Definition Flowchart

The vector stencils library "HR flowchart" contains 62 flow chart symbols.
Use it to design your HR flowcharts, workflow diagrams and process charts by the ConceptDraw PRO diagramming and vector drawing software.
"Flowcharts are used in designing and documenting simple processes or programs. Like other types of diagrams, they help visualize what is going on and thereby help understand a process, and perhaps also find flaws, bottlenecks, and other less-obvious features within it. There are many different types of flowcharts, and each type has its own repertoire of boxes and notational conventions. The two most common types of boxes in a flowchart are:
(1) a processing step, usually called activity, and denoted as a rectangular box,
(2) a decision, usually denoted as a diamond." [Flowchart. Wikipedia]
The shapes example "Design elements - HR flowchart" is included in the HR Flowcharts solution from the Management area of ConceptDraw Solution Park.
Flowchart symbols
"The symbols and conventions used in welding documentation are specified in national and international standards such as ISO 2553 Welded, brazed and soldered joints -- Symbolic representation on drawings and ISO 4063 Welding and allied processes -- Nomenclature of processes and reference numbers. The US standard symbols are outlined by the American National Standards Institute and the American Welding Society and are noted as "ANSI/ AWS".
In engineering drawings, each weld is conventionally identified by an arrow which points to the joint to be welded. The arrow is annotated with letters, numbers and symbols which indicate the exact specification of the weld. In complex applications, such as those involving alloys other than mild steel, more information may be called for than can comfortably be indicated using the symbols alone. Annotations are used in these cases." [Symbols and conventions used in welding documentation. Wikipedia]
The example chart "Elements of welding symbol" is redesigned using the ConceptDraw PRO diagramming and vector drawing software from the Wikipedia file: Elements of a welding symbol.PNG.
[en.wikipedia.org/ wiki/ File:Elements_ of_ a_ welding_ symbol.PNG]
The diagram example "Elements location of a welding symbol" is contained in the Mechanical Engineering solution from the Engineering area of ConceptDraw Solution Park.
Welding joint symbol chart

Types of Welding in Flowchart

The vector stencils library "Sales flowchart" contains 62 flow chart symbols.
Use it to design your sales flowcharts, workflow diagrams and process charts by the ConceptDraw PRO diagramming and vector drawing software.
"Flowcharts are used in designing and documenting simple processes or programs. Like other types of diagrams, they help visualize what is going on and thereby help understand a process, and perhaps also find flaws, bottlenecks, and other less-obvious features within it. There are many different types of flowcharts, and each type has its own repertoire of boxes and notational conventions. The two most common types of boxes in a flowchart are:
(1) a processing step, usually called activity, and denoted as a rectangular box,
(2) a decision, usually denoted as a diamond." [Flowchart. Wikipedia]
The shapes example "Design elements - Sales flowchart" is included in the Sales Flowcharts solution from the Marketing area of ConceptDraw Solution Park.
Flowchart symbols
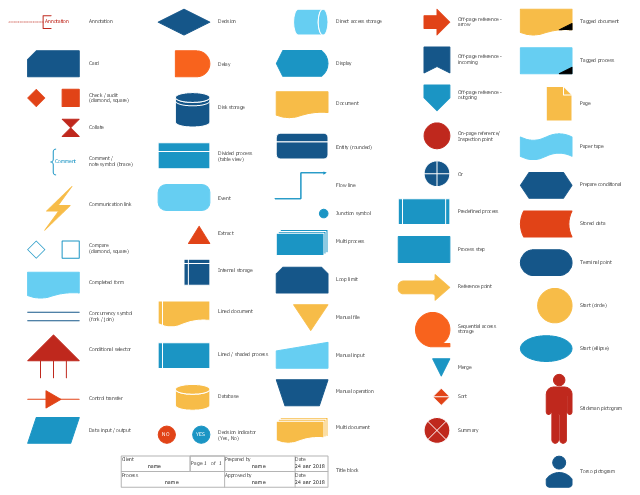
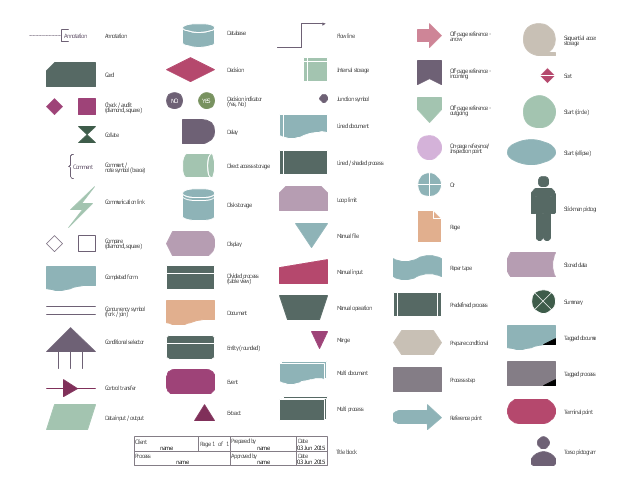
The vector stencils library "Process flowcharts" contains 30 symbols for creating the deployment flow charts, cross-functional flowcharts and swim lane diagrams using the ConceptDraw PRO diagramming and vector drawing software.
"A deployment flowchart (sometimes referred to as a "cross functional flowchart") is a business process mapping tool used to articulate the steps and stakeholders of a given process. ...
As deployment flowcharts highlight the relationships between stakeholders in addition to the process flow they are especially useful in highlighting areas of inefficiency, duplication or unnecessary processing. Often utilized within Six sigma activity, completed flowcharts are commonly used to examine the interfaces between “participants” which are typically causes for delays and other associated issues. Deployment flowcharts are useful for determining who within an organization is required to implement a process and are sometimes used as a business planning tool." [Deployment flowchart. Wikipedia]
The shapes example "Design elements - Process flowcharts" is included in the Process Flowcharts solution from the Business Processes area of ConceptDraw Solution Park.
Cross-functional flowchart shapes
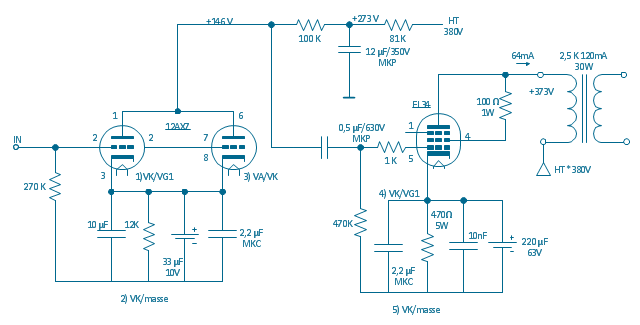
"In electronics, a vacuum tube, electron tube (in North America), tube, or thermionic valve or valve (in British English) is a device controlling electric current through a vacuum in a sealed container. The simplest vacuum tube, the diode, contains only two elements; current can only flow in one direction through the device between the two electrodes, as electrons emitted by the hot cathode travel through the tube and are collected by the anode. Addition of a third and additional electrodes allows the current flowing between cathode and anode to be controlled in various ways. The device can be used as an electronic amplifier, a rectifier, an electronically controlled switch, an oscillator, and for other purposes.
Vacuum tubes mostly rely on thermionic emission of electrons from a hot filament or a cathode heated by the filament. Some electron tube devices rely on the properties of a discharge through an ionized gas." [Vacuum tube. Wikipedia]
"The EL34 is a thermionic valve or vacuum tube of the power pentode type. It has an international octal base (indicated by the '3' in the part number) and is found mainly in the final output stages of audio amplification circuits and was designed to be suitable as a series regulator by virtue of its high permissible voltage between heater and cathode and other parameters. The American RETMA tube designation number for this tube is 6CA7. Russian analog is 6P27S (Cyrillic: 6П27C )" [EL34. Wikipedia]
This circuit diagram sample was redrawn from the Wikipedia Commons file: EL34 schematics (circuit diagram).gif. [commons.wikimedia.org/ wiki/ File:EL34_ schematics_ %28circuit_ diagram%29.gif]
The example "Circuit diagram - EL 34 schematics" was drawn using the ConceptDraw PRO diagramming and vector drawing software extended with the Electrical Engineering solution from the Engineering area of ConceptDraw Solution Park.
EL34 shemathics
Football – 2014 FIFA World Cup Standings Group

Account FlowchartFlowchart Examples

The library of vector stencils "Fishbone diagrams" contains 13 symbols for drawing the Ishikawa diagrams using the ConceptDraw PRO diagramming and vector drawing software.
"Ishikawa diagrams were popularized by Kaoru Ishikawa in the 1960s, who pioneered quality management processes in the Kawasaki shipyards, and in the process became one of the founding fathers of modern management.
The basic concept was first used in the 1920s, and is considered one of the seven basic tools of quality control. It is known as a fishbone diagram because of its shape, similar to the side view of a fish skeleton." [Ishikawa diagram. Wikipedia]
"The Seven Basic Tools of Quality is a designation given to a fixed set of graphical techniques identified as being most helpful in troubleshooting issues related to quality. They are called basic because they are suitable for people with little formal training in statistics and because they can be used to solve the vast majority of quality-related issues.
The seven tools are:
(1) Cause-and-effect diagram (also known as the "fishbone" or Ishikawa diagram);
(2) Check sheet;
(3) Control chart;
(4) Histogram;
(5) Pareto chart;
(6) Scatter diagram;
(7) Stratification (alternately, flow chart or run chart)." [Seven Basic Tools of Quality. Wikipedia]
The example "Design elements - Fishbone diagram" is included in the Fishbone Diagrams solution from the Management area of ConceptDraw Solution Park.
Ishikawa diagram symbols

The vector stencils library "Audit flowcharts" contains 31 symbols of audit flow chart diagrams for accounting, financial management, fiscal information tracking, money management, decision flowcharts, and financial inventories.
"A financial audit, or more accurately, an audit of financial statements, is the verification of the financial statements of a legal entity, with a view to express an audit opinion. The audit opinion is intended to provide reasonable assurance, but not absolute assurance, that the financial statements are presented fairly, in all material respects, and/ or give a true and fair view in accordance with the financial reporting framework. The purpose of an audit is to provide an objective independent examination of the financial statements, which increases the value and credibility of the financial statements produced by management, thus increase user confidence in the financial statement, reduce investor risk and consequently reduce the cost of capital of the preparer of the financial statements. ...
Financial audits are typically performed by firms of practicing accountants who are experts in financial reporting. The financial audit is one of many assurance functions provided by accounting firms. Many organizations separately employ or hire internal auditors, who do not attest to financial reports but focus mainly on the internal controls of the organization. External auditors may choose to place limited reliance on the work of internal auditors. Auditing promotes transparency and accuracy in the financial disclosures made by an organization, therefore would likely to reduce of such corporations to conceal unscrupulous dealings.
Internationally, the International Standards on Auditing (ISA) issued by the International Auditing and Assurance Standards Board (IAASB) is considered as the benchmark for audit process. Almost all jurisdictions require auditors to follow the ISA or a local variation of the ISA." [Financial audit. Wikipedia]
The example "Design elements - Audit flowchart" was created using the ConceptDraw PRO diagramming and vector drawing software extended with the Audit Flowcharts solution from the Finance and Accounting area of ConceptDraw Solution Park.
Audit flowchart symbols

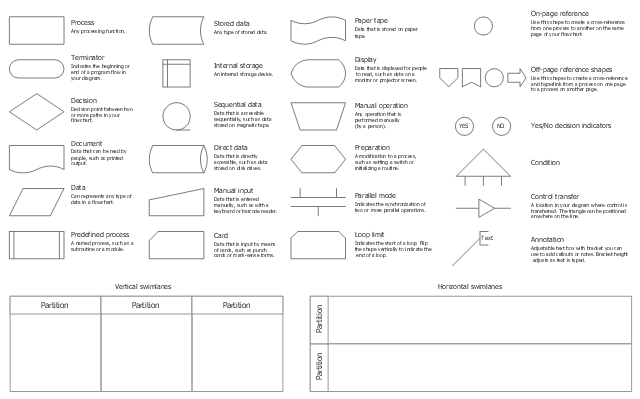
The vector stencils library "Flowchart" contains 26 symbols for drawing the flow charts using the ConceptDraw PRO diagramming and vector drawing software.
"Flowcharts are used in designing and documenting complex processes or programs. Like other types of diagrams, they help visualize what is going on and thereby help the viewer to understand a process, and perhaps also find flaws, bottlenecks, and other less-obvious features within it. There are many different types of flowcharts, and each type has its own repertoire of boxes and notational conventions. The two most common types of boxes in a flowchart are:
(1) a processing step, usually called activity, and denoted as a rectangular box;
(2) a decision, usually denoted as a diamond.
A flowchart is described as "cross-functional" when the page is divided into different swimlanes describing the control of different organizational units. A symbol appearing in a particular "lane" is within the control of that organizational unit. This technique allows the author to locate the responsibility for performing an action or making a decision correctly, showing the responsibility of each organizational unit for different parts of a single process. ...
Common alternate names include: flowchart, process flowchart, functional flowchart, process map, process chart, functional process chart, business process model, process model, process flow diagram, work flow diagram, business flow diagram. The terms "flowchart" and "flow chart" are used interchangeably." [Flowchart. Wikipedia]
The example "Design elements - Flowchart" is included in the Flowcharts solution from the area "What is a Diagram" of ConceptDraw Solution Park.
Flowchart notation

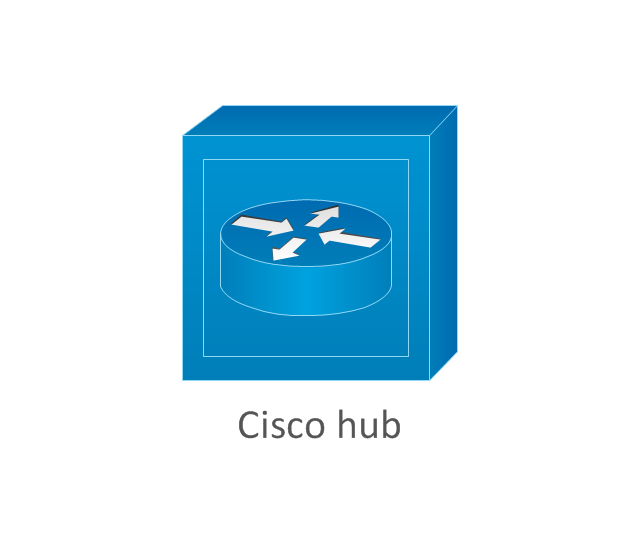
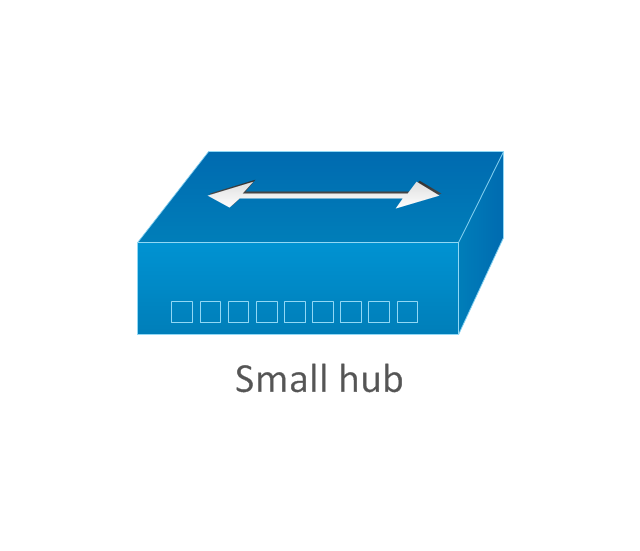
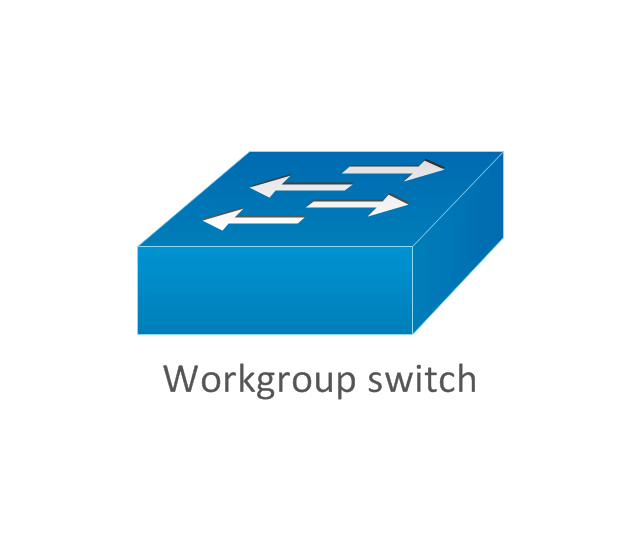
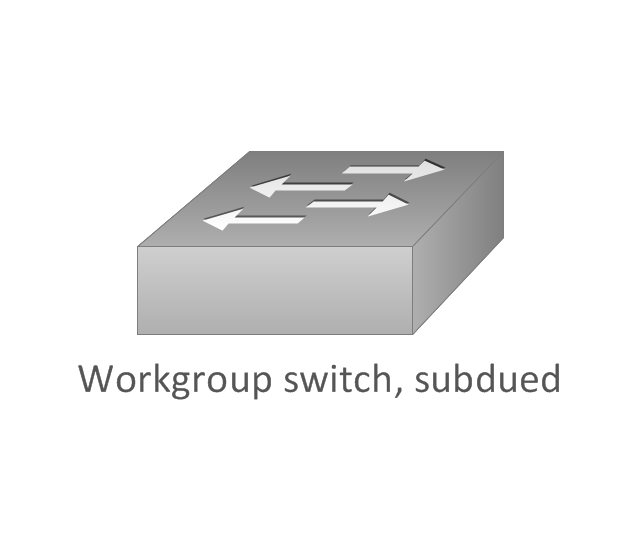
The vector stencils library "Cisco switches and hubs" contains 26 symbols of Cisco switches and hubs for drawing computer network diagrams.
"A switch is a device used on a computer network to physically connect devices together. Multiple cables can be connected to a switch to enable networked devices to communicate with each other. Switches manage the flow of data across a network by only transmitting a received message to the device for which the message was intended. Each networked device connected to a switch can be identified using a MAC address, allowing the switch to regulate the flow of traffic. This maximises security and efficiency of the network. Because of these features, a switch is often considered more "intelligent" than a network hub. Hubs neither provide security, or identification of connected devices. This means that messages have to be transmitted out of every port of the hub, greatly degrading the efficiency of the network." [Network switch. Wikipedia]
"An Ethernet hub, active hub, network hub, repeater hub, multiport repeater or hub is a device for connecting multiple Ethernet devices together and making them act as a single network segment. It has multiple input/ output (I/ O) ports, in which a signal introduced at the input of any port appears at the output of every port except the original incoming. A hub works at the physical layer (layer 1) of the OSI model. The device is a form of multiport repeater. Repeater hubs also participate in collision detection, forwarding a jam signal to all ports if it detects a collision." [Ethernet hub. Wikipedia]
The symbols example "Cisco switches and hubs - Vector stencils library" was created using the ConceptDraw PRO diagramming and vector drawing software extended with the Cisco Network Diagrams solution from the Computer and Networks area of ConceptDraw Solution Park.
www.conceptdraw.com/ solution-park/ computer-networks-cisco
Cisco hub
100BaseT hub

Small hub
Workgroup switch
Workgroup switch, subdued
Voice-enabled workgroup switch
ATM switch
LAN2LAN switch
ISDN switch
MGX 8000 multiservice switch

Multilayer switch with Si
Multilayer switch
Multilayer switch with Si, subdued
Program switch
Data center switch

Voice-enabled ATM switch
IP DSL switch

Content switch
Content service switch 1100
Virtual layer switch
Layer 2 remote switch
Server switch
Multilayer remote switch

Multifabric server switch
Access gateway
Long-Reach CPE
Settlement Process Flowchart. Flowchart Examples

Venn Diagram Examples for Problem SolvingVenn Diagram as a Truth Table

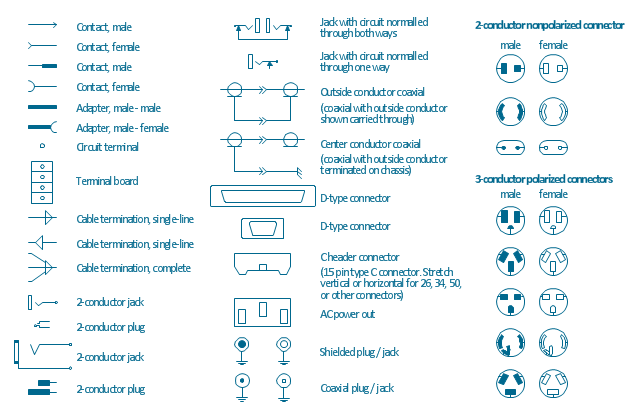
The vector stencils library "Terminals and connectors" contains 43 element symbols of terminals, connectors, plugs, polarized connectors, jacks, coaxial cables, and conductors.
Use it for drawing the wiring diagrams, electrical layouts, electronic schematics, and circuit diagrams.
"An electrical connector is an electro-mechanical device for joining electrical circuits as an interface using a mechanical assembly. Connectors consist of plugs (male-ended) and jacks (female-ended). The connection may be temporary, as for portable equipment, require a tool for assembly and removal, or serve as a permanent electrical joint between two wires or devices. An adapter can be used to effectively bring together dissimilar connectors.
There are hundreds of types of electrical connectors. Connectors may join two lengths of flexible copper wire or cable, or connect a wire or cable or optical interface to an electrical terminal.
In computing, an electrical connector can also be known as a physical interface... Cable glands, known as cable connectors in the US, connect wires to devices mechanically rather than electrically and are distinct from quick-disconnects performing the latter." [Electrical connector. Wikipedia]
"A terminal is the point at which a conductor from an electrical component, device or network comes to an end and provides a point of connection to external circuits. A terminal may simply be the end of a wire or it may be fitted with a connector or fastener. In network analysis, terminal means a point at which connections can be made to a network in theory and does not necessarily refer to any real physical object. In this context, especially in older documents, it is sometimes called a "pole".
The connection may be temporary, as seen in portable equipment, may require a tool for assembly and removal, or may be a permanent electrical joint between two wires or devices.
All electric cell have two terminals. The first is the positive terminal and the second is the negative terminal. The positive terminal looks like a metal cap and the negative terminal looks like a metal disc. The current flows from the positive terminal, and out through the negative terminal, replicative of current flow (positive (+) to negative (-) flow)." [Terminal (electronics). Wikipedia]
The shapes example "Design elements - Terminals and connectors" was drawn using the ConceptDraw PRO diagramming and vector drawing software extended with the Electrical Engineering solution from the Engineering area of ConceptDraw Solution Park.
Terminal and connector symbols
The vector stencils library Registers, drills and diffusers contains 47 symbols of rectangular, circular, linear and troffer air handling inlet/ outlet components.
Use the design elements library Registers, drills and diffusers to draw reflected ceiling plans (RCP) and HVAC layout floor plans using the ConceptDraw PRO diagramming and vector drawing software.
"A ceiling is an overhead interior surface that covers the upper limit of a room. It is not generally considered a structural element, but a finished surface concealing the underside of the floor or roof structure above.
Ceilings are classified according to their appearance or construction. A cathedral ceiling is any tall ceiling area similar to those in a church. A dropped ceiling is one in which the finished surface is constructed anywhere from a few inches to several feet below the structure above it. This may be done for aesthetic purposes, such as achieving a desirable ceiling height; or practical purposes such as providing a space for HVAC or piping. An inverse of this would be a raised floor. A concave or barrel shaped ceiling is curved or rounded, usually for visual or acoustical value, while a coffered ceiling is divided into a grid of recessed square or octagonal panels, also called a "lacunar ceiling". A cove ceiling uses a curved plaster transition between wall and ceiling; it is named for cove molding, a molding with a concave curve." [Ceiling. Wikipedia]
"... reflected Ceiling Plans (RCP)s showing ceiling layouts appear after the floor plans." [Plan (drawing). Wikipedia]
The shapes library "Registers, drills and diffusers" is contained in the Reflected Ceiling Plans solution from the Building Plans area of ConceptDraw Solution Park.
Reflected ceiling plan symbols

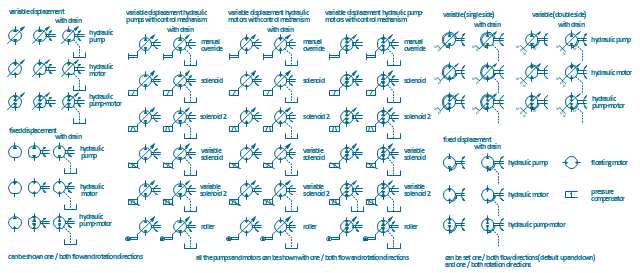
The vector stencils library "Hydraulic pumps and motors" contains 74 symbols of hydraulic pump vector stencils, hydraulic motor symbols for engineering drawings of fluid power and hydraulic control systems.
"Hydraulic pumps are used in hydraulic drive systems and can be hydrostatic or hydrodynamic.
Hydrostatic pumps are positive displacement pumps while hydrodynamic pumps can be fixed displacement pumps, in which the displacement (flow through the pump per rotation of the pump) cannot be adjusted, or variable displacement pumps, which have a more complicated construction that allows the displacement to be adjusted." [Hydraulic pump. Wikipedia]
"A hydraulic motor is a mechanical actuator that converts hydraulic pressure and flow into torque and angular displacement (rotation). The hydraulic motor is the rotary counterpart of the hydraulic cylinder.
Conceptually, a hydraulic motor should be interchangeable with a hydraulic pump because it performs the opposite function - much as the conceptual DC electric motor is interchangeable with a DC electrical generator. However, most hydraulic pumps cannot be used as hydraulic motors because they cannot be backdriven. Also, a hydraulic motor is usually designed for the working pressure at both sides of the motor.
Hydraulic pumps, motors, and cylinders can be combined into hydraulic drive systems. One or more hydraulic pumps, coupled to one or more hydraulic motors, constitutes a hydraulic transmission." [Hydraulic motor. Wikipedia]
The shapes example "Design elements - Hydraulic pumps and motors" was created using the ConceptDraw PRO diagramming and vector drawing software extended with the Mechanical Engineering solution from the Engineering area of ConceptDraw Solution Park.
Hydraulic pump and motor symbols
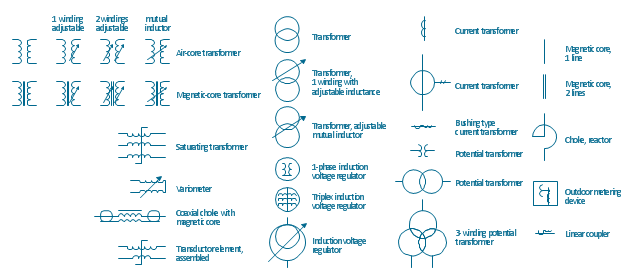
The vector stencils library "Transformers and windings" contains 29 element symbols of transformers, windings, couplers, metering devices, transductors, magnetic cores, chokes, and a variometer.
Use it to design the electromechanical device schematics and electronic circuit diagrams.
"A transformer is an electrical device that transfers energy between two circuits through electromagnetic induction. Transformers may be used in step-up or step-down voltage conversion, which 'transforms' an AC voltage from one voltage level on the input of the device to another level at the output terminals. This special function of transformers can provide control of specified requirements of current level as an alternating current source, or it may be used for impedance matching between mismatched electrical circuits to effect maximum power transfer between the circuits.
A transformer most commonly consists of two windings of wire that are wound around a common core to induce tight electromagnetic coupling between the windings. The core material is often a laminated iron core. The coil that receives the electrical input energy is referred to as the primary winding, while the output coil is called the secondary winding.
An alternating electric current flowing through the primary winding (coil) of a transformer generates an electromagnetic field in its surroundings and a varying magnetic flux in the core of the transformer. By electromagnetic induction this magnetic flux generates a varying electromotive force in the secondary winding, resulting in a voltage across the output terminals. If a load impedance is connected across the secondary winding, a current flows through the secondary winding drawing power from the primary winding and its power source." [Transformer. Wikipedia]
"An electromagnetic coil (or simply a "coil") is formed when a conductor is wound around a core or form to create an inductor or electromagnet. When electricity is passed through a coil, it generates a magnetic field. One loop of wire is usually referred to as a turn or a winding, and a coil consists of one or more turns. For use in an electronic circuit, electrical connection terminals called taps are often connected to a coil. Coils are often coated with varnish or wrapped with insulating tape to provide additional insulation and secure them in place. A completed coil assembly with one or more set of coils and taps is often called the windings.
Windings are used in transformers, electric motors, inductors, solenoids, loudspeakers, and many other applications." [Electromagnetic coil. Wikipedia]
The shapes example "Design elements - Transformers and windings" was drawn using the ConceptDraw PRO diagramming and vector drawing software extended with the Electrical Engineering solution from the Engineering area of ConceptDraw Solution Park.
Transformer and winding symbols
 People
This solution extends ConceptDraw DIAGRAM software with samples, templates and libraries of vector clipart for drawing the People illustrations. Use it to make professional-looking documents, presentations and websites illustrated with color scalable vector c
- Design elements - Process flowchart | Flowcharting Symbols Wiki
- Design elements - Process flowchart | Flowchart Symbol Wiki
- Account Flowchart . Flowchart Examples | Audit planning flowchart ...
- Design elements - Process flowchart | Design elements - Flowchart ...
- Design elements - Process flowchart | Flow Chart Symbols Wikipedia
- Design elements - Process flowchart | Design elements - Sales ...
- Design elements - Cross-functional flowcharts | Providing telecom ...
- People | Lead to opportunity sales flow | Workflow Wiki
- Welding Corner Joint Definition Wikipedia
- Euclidean algorithm - Flowchart | Flowchart And Algorithms Wikipedia