"Telecommunication is communication at a distance by technological means, particularly through electrical signals or electromagnetic waves. ...
Electrical and electromagnetic telecommunication technologies include telegraph, telephone, and teleprinter, networks, radio, microwave transmission, fiber optics, communications satellites and the Internet." [Telecommunication. Wikipedia]
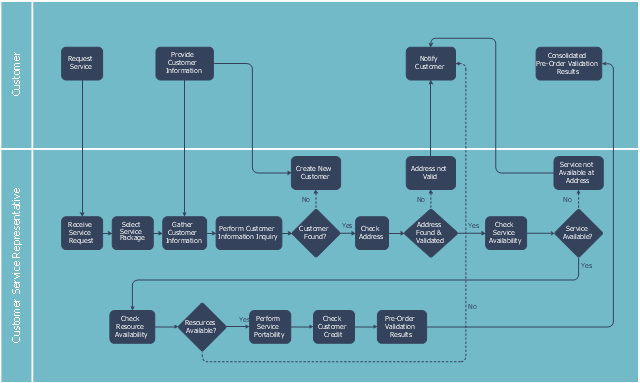
"A telecommunications service provider or TSP is a type of communications service provider that has traditionally provided telephone and similar services. This category includes incumbent local exchange carriers, competitive local exchange carriers, and mobile wireless communication companies. ...
While some people use the terms "telecom service provider" and "communications service provider" interchangeably, the term TSP generally excludes Internet service providers (ISPs), cable companies, satellite TV, and managed service providers. ...
TSPs provide access to telephone and related communications services." [Telecommunications service provider. Wikipedia]
The cross-functional flowchart example "Providing telecom services" was created using the ConceptDraw PRO diagramming and vector drawing software extended with the Cross-Functional Flowcharts solution from the Business Processes area of ConceptDraw Solution Park.
Electrical and electromagnetic telecommunication technologies include telegraph, telephone, and teleprinter, networks, radio, microwave transmission, fiber optics, communications satellites and the Internet." [Telecommunication. Wikipedia]
"A telecommunications service provider or TSP is a type of communications service provider that has traditionally provided telephone and similar services. This category includes incumbent local exchange carriers, competitive local exchange carriers, and mobile wireless communication companies. ...
While some people use the terms "telecom service provider" and "communications service provider" interchangeably, the term TSP generally excludes Internet service providers (ISPs), cable companies, satellite TV, and managed service providers. ...
TSPs provide access to telephone and related communications services." [Telecommunications service provider. Wikipedia]
The cross-functional flowchart example "Providing telecom services" was created using the ConceptDraw PRO diagramming and vector drawing software extended with the Cross-Functional Flowcharts solution from the Business Processes area of ConceptDraw Solution Park.
Cross-functional flow chart
"In elementary algebra, a quadratic equation (from the Latin quadratus for "square") is any equation having the form
ax^2+bx+c=0
where x represents an unknown, and a, b, and c are constants with a not equal to 0. If a = 0, then the equation is linear, not quadratic. The constants a, b, and c are called, respectively, the quadratic coefficient, the linear coefficient and the constant or free term.
Because the quadratic equation involves only one unknown, it is called "univariate". The quadratic equation only contains powers of x that are non-negative integers, and therefore it is a polynomial equation, and in particular it is a second degree polynomial equation since the greatest power is two.
Quadratic equations can be solved by a process known in American English as factoring and in other varieties of English as factorising, by completing the square, by using the quadratic formula, or by graphing." [Quadratic equation. Wikipedia]
The flowchart example "Solving quadratic equation algorithm" was created using the ConceptDraw PRO diagramming and vector drawing software extended with the Mathematics solution from the Science and Education area of ConceptDraw Solution Park.
Solving quadratic equation flow chart

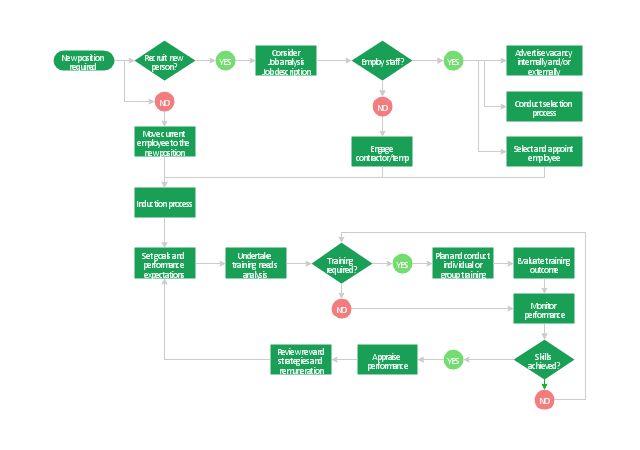
"Human resource management (HRM, or simply HR) is the management process of an organization's workforce, or human resources. It is responsible for the attraction, selection, training, assessment, and rewarding of employees, while also overseeing organizational leadership and culture and ensuring compliance with employment and labor laws. In circumstances where employees desire and are legally authorized to hold a collective bargaining agreement, HR will also serve as the company's primary liaison with the employees' representatives (usually a trades union).
HR is a product of the human relations movement of the early 20th century, when researchers began documenting ways of creating business value through the strategic management of the workforce. The function was initially dominated by transactional work, such as payroll and benefits administration, but due to globalization, company consolidation, technological advancement, and further research, HR now focuses on strategic initiatives like mergers and acquisitions, talent management, succession planning, industrial and labor relations, and diversity and inclusion." [Human resource management. Wikipedia]
The flow chart example "HR management process" was created using the ConceptDraw PRO diagramming and vector drawing software extended with the Flowcharts solution from the area "What is a Diagram" of ConceptDraw Solution Park.
Flowchart - HR management process
"A project management process is the management process of planning and controlling the performance or execution of a project. ...
Inputs:
(1) Documented need to act.
(2) Project plan templates.
(3) Lessons learned from previous projects.
(4) Existing project management standards.
(5) External information.
(6) Resources for project planning and project execution.
Process:
(1) Project initiation.
(2) Project planning.
(3) Project execution.
(4) Project control and validation.
(5) Project closeout.
Outputs:
(1) Project products delivered.
(2) Project objectives achieved (as a result of the interplay among project products and the organization or its environment).
(3) Lessons learned documented." [Project management process. Wikipedia]
The audit flowchart example "Project management process" was created using the ConceptDraw PRO diagramming and vector drawing software extended with the Audit Flowcharts solution from the Finance and Accounting area of ConceptDraw Solution Park.
www.conceptdraw.com/ solution-park/ finance-audit-flowcharts
Audit flowchart

The vector stencils library "Process flowchart" contains 9 flow chart symbols.
Use it to design your process flowcharts with ConceptDraw PRO diagramming and vector drawing software.
"A flowchart is a type of diagram that represents an algorithm, workflow or process, showing the steps as boxes of various kinds, and their order by connecting them with arrows. ...
Kaoru Ishikawa defined the flowchart as one of the seven basic tools of quality control, next to the histogram, Pareto chart, check sheet, control chart, cause-and-effect diagram, and the scatter diagram. ...
Common alternative names include: flowchart, process flowchart, functional flowchart, process map, process chart, functional process chart, business process model, process model, process flow diagram, work flow diagram, business flow diagram. The terms "flowchart" and "flow chart" are used interchangeably." [Flowchart. Wikipedia]
The example of flow chart symbols "Design elements - Process flowchart" is included in the Seven Basic Tools of Quality solution from the Quality area of ConceptDraw Solution Park.
Process flowchart symbols

"A Guide to the Project Management Body of Knowledge - Fifth Edition provides guidelines for managing individual projects and defines project management related concepts. It also describes the project management life cycle and its related processes, as well as the project life cycle.
The Guide recognizes 47 processes that fall into five basic process groups and ten knowledge areas that are typical of almost all projects.
The five process groups are:
Initiating,
Planning,
Executing,
Monitoring and Controlling,
Closing.
The ten knowledge areas are:
Project Integration Management,
Project Scope Management,
Project Time Management,
Project Cost Management,
Project Quality Management,
Project Human Resource Management,
Project Communications Management,
Project Risk Management,
Project Procurement Management,
Project Stakeholders Management (added in 5th edition).
Each of the ten knowledge areas contains the processes that need to be accomplished within its discipline in order to achieve an effective project management program. Each of these processes also falls into one of the five basic process groups, creating a matrix structure such that every process can be related to one knowledge area and one process group." [A Guide to the Project Management Body of Knowledge. Wikipedia]
The flow chart example "Project management life cycle" was created using the ConceptDraw PRO diagramming and vector drawing software extended with the Flowcharts solution from the area "What is a Diagram" of ConceptDraw Solution Park.
Flowchart - Project management life cycle

The vector stencils library "Flowchart" contains 26 symbols for drawing the flow charts using the ConceptDraw PRO diagramming and vector drawing software.
"Flowcharts are used in designing and documenting complex processes or programs. Like other types of diagrams, they help visualize what is going on and thereby help the viewer to understand a process, and perhaps also find flaws, bottlenecks, and other less-obvious features within it. There are many different types of flowcharts, and each type has its own repertoire of boxes and notational conventions. The two most common types of boxes in a flowchart are:
(1) a processing step, usually called activity, and denoted as a rectangular box;
(2) a decision, usually denoted as a diamond.
A flowchart is described as "cross-functional" when the page is divided into different swimlanes describing the control of different organizational units. A symbol appearing in a particular "lane" is within the control of that organizational unit. This technique allows the author to locate the responsibility for performing an action or making a decision correctly, showing the responsibility of each organizational unit for different parts of a single process. ...
Common alternate names include: flowchart, process flowchart, functional flowchart, process map, process chart, functional process chart, business process model, process model, process flow diagram, work flow diagram, business flow diagram. The terms "flowchart" and "flow chart" are used interchangeably." [Flowchart. Wikipedia]
The example "Design elements - Flowchart" is included in the Flowcharts solution from the area "What is a Diagram" of ConceptDraw Solution Park.
Flowchart notation

This flow chart sample was drawn on the base on the illustration of the article "Climate change impact on China food security in 2050" from the website of Chinese Academy of Agricultural Sciences .
[caas.cn/ en/ newsroom/ research_ update/ 67347.shtml]
"Food security is a condition related to the ongoing availability of food. ...
According to the Food and Agriculture Organization (FAO), food security "exists when all people, at all times, have physical and economic access to sufficient, safe and nutritious food to meet their dietary needs and food preferences for an active and healthy life". ...
Extreme events, such as droughts and floods, are forecast to increase as climate change takes hold. Ranging from overnight floods to gradually worsening droughts, these will have a range of impacts on the agricultural sector. ...
According to the Climate & Development Knowledge Network report Managing Climate Extremes and Disasters in the Agriculture Sectors: Lessons from the IPCC SREX Report, the impacts will include changing productivity and livelihood patterns, economic losses, and impacts on infrastructure, markets and food security. Food security in future will be linked to our ability to adapt agricultural systems to extreme events." [Food security. Wikipedia]
The flowchart example "Food security assessment" was created using the ConceptDraw PRO diagramming and vector drawing software extended with the Flowcharts solution from the area "What is a Diagram" of ConceptDraw Solution Park.
Flowchart

- Relations diagram - Health care | Cross-Functional Flowchart ...
- Cross Functional Flowchart Wikipedia
- Green Hrm Wikipedia
- A Flowchart To Show How Wikipedia Is Created
- Euclidean algorithm - Flowchart | Euclid Wikipedia
- Difference Between Algorithm And Flowchart Wikipedia
- HR management process - Flowchart | Human Resources ...
- How To Create A Wikipedia Page Flow Chart
- Solving quadratic equation algorithm - Flowchart | Www Wikipedia ...