Pyramid Diagram

Basic Flowchart Symbols and Meaning


HelpDesk
How to Create a House of Quality Diagram

This house of quality matrix sample was designed on the base of the Wikimedia Commons file: Casa de la calidad QFD.png.
[commons.wikimedia.org/ wiki/ File:A1_ House_ of_ Quality.png]
This file is made available under the Creative Commons CC0 1.0 Universal Public Domain Dedication. [creativecommons.org/ publicdomain/ zero/ 1.0/ deed.en]
"The house of quality, a part of QFD, identifies and classifies customer desires, identifies the importance of those desires, identifies engineering characteristics which may be relevant to those desires, correlates the two, allows for verification of those correlations, and then assigns objectives and priorities for the system requirements. This process can be applied at any system composition level (e.g. system, subsystem, or component) in the design of a product, and can allow for assessment of different abstractions of a system." [Quality function deployment. Wikipedia]
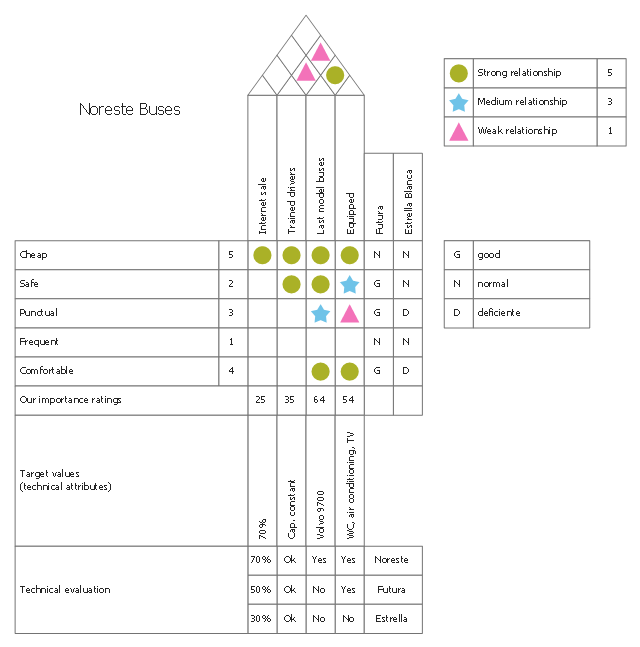
The HOQ example "House of quality of buses" was designed using ConceptDraw PRO software extended with House of Quality solution from Quality area of ConceptDraw PRO Solution Park.
[commons.wikimedia.org/ wiki/ File:A1_ House_ of_ Quality.png]
This file is made available under the Creative Commons CC0 1.0 Universal Public Domain Dedication. [creativecommons.org/ publicdomain/ zero/ 1.0/ deed.en]
"The house of quality, a part of QFD, identifies and classifies customer desires, identifies the importance of those desires, identifies engineering characteristics which may be relevant to those desires, correlates the two, allows for verification of those correlations, and then assigns objectives and priorities for the system requirements. This process can be applied at any system composition level (e.g. system, subsystem, or component) in the design of a product, and can allow for assessment of different abstractions of a system." [Quality function deployment. Wikipedia]
The HOQ example "House of quality of buses" was designed using ConceptDraw PRO software extended with House of Quality solution from Quality area of ConceptDraw PRO Solution Park.
HOQ matrix
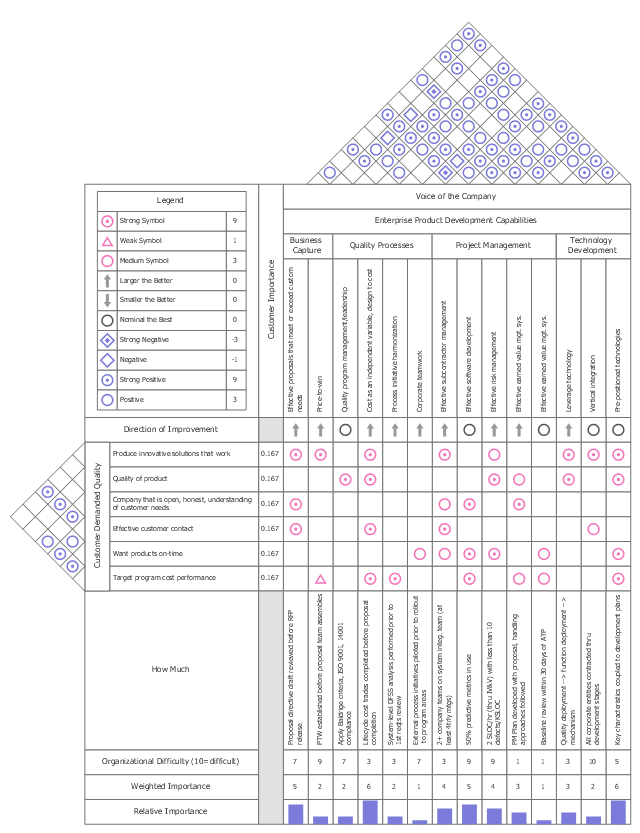
This house of quality matrix sample was designed on the base of the Wikimedia Commons file: A1 House of Quality.png.
"House of Quality is a diagram, resembling a house, used for defining the relationship between customer desires and the firm/ product capabilities" [commons.wikimedia.org/ wiki/ File:A1_ House_ of_ Quality.png]
The HOQ example "House of quality diagram" was designed using ConceptDraw PRO software extended with House of Quality solution from Quality area of ConceptDraw PRO Solution Park.
HOQ matrix
Total Quality Management

Audit Flowchart Symbols

Quality Control Chart Software — ISO Flowcharting

Spider Chart Template

Project management - Design Elements

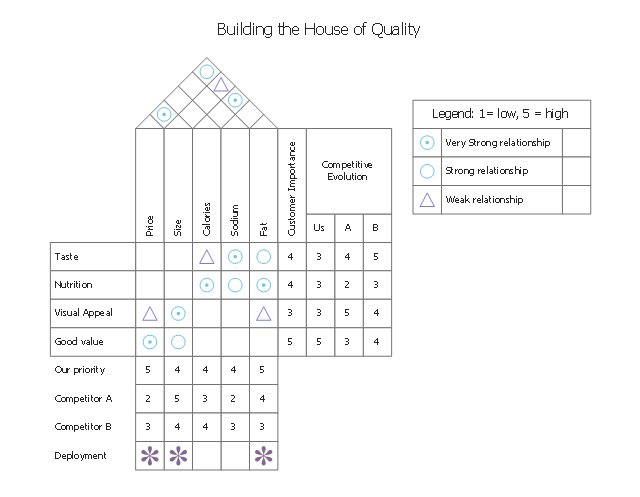
This house of quality matrix sample was designed on the base of the Wikimedia Commons file: Building the House of Quality - Example.jpg. [commons.wikimedia.org/ wiki/ File:Building_ the_ House_ of_ Quality_ -_ Example.jpg]
This file is licensed under the Creative Commons Attribution-Share Alike 4.0 International license. [creativecommons.org/ licenses/ by-sa/ 4.0/ deed.en]
"The “house of quality,” the basic design tool of the management approach known as quality function deployment (QFD)...
The foundation of the house of quality is the belief that products should be designed to reflect customers’ desires and tastes—so marketing people, design engineers, and manufacturing staff must work closely together from the time a product is first conceived.
The house of quality is a kind of conceptual map that provides the means for interfunctional planning and communications. People with different problems and responsibilities can thrash out design priorities while referring to patterns of evidence on the house’s grid." [Hauser, John R.; Clausing, Don. "The House of Quality". Harvard Business Review. No. May 1988. hbr.org/ 1988/ 05/ the-house-of-quality]
The HOQ example "Building the House of Quality" was designed using ConceptDraw PRO software extended with House of Quality solution from Quality area of ConceptDraw PRO Solution Park.
HOQ matrix
ConceptDraw DIAGRAM Compatibility with MS Visio

 House of Quality
House of Quality solution provides the powerful drawing tools, numerous specific samples and examples, and set of vector design elements of House of Quality shapes and symbols, which will help you in application the Quality function deployment (QFD) methodology and in easy creation the House of Quality Matrices intended for satisfaction the consumers' desires and requirements, for representing them in a visual way and then transformation into the targets and technical requirements to be followed for development the best products.
Chemistry Equation Symbols

Advanced printing in ConceptDraw PROJECT

Software for flowchart diagrams

How to Use Skype for Sharing Documents


The vector stencils library "Cisco LAN" contains 23 symbols of local area network (LAN) devices and equipment for drawing Cisco LAN topology diagrams.
"Network topology describes the layout of interconnections between devices and network segments. At the Data Link Layer and Physical Layer, a wide variety of LAN topologies have been used, including ring, bus, mesh and star, but the most common LAN topology in use today is switched Ethernet. At the higher layers, the Internet Protocol (TCP/ IP) has become the standard, replacing NetBEUI, IPX/ SPX, AppleTalk and others.
Simple LANs generally consist of one or more switches. A switch can be connected to a router, cable modem, or ADSL modem for Internet access. Complex LANs are characterized by their use of redundant links with switches using the spanning tree protocol to prevent loops, their ability to manage differing traffic types via quality of service (QoS), and to segregate traffic with VLANs. A LAN can include a wide variety of network devices such as switches, firewalls, routers, load balancers, and sensors.
LANs can maintain connections with other LANs via leased lines, leased services, or the Internet using virtual private network technologies. Depending on how the connections are established and secured in a LAN, and the distance involved, a LAN may also be classified as a metropolitan area network (MAN) or a wide area network (WAN)." [Local area network. Wikipedia]
The symbols example "Cisco LAN - Vector stencils library" was created using the ConceptDraw PRO diagramming and vector drawing software extended with the Cisco Network Diagrams solution from the Computer and Networks area of ConceptDraw Solution Park.
www.conceptdraw.com/ solution-park/ computer-networks-cisco
Sun workstation
Workstation
PC
Macintosh
Terminal
Mini VAX
Printer
Laptop
File server
Monitor
Web cluster
ATM fast gigabit etherswitch

HP Mini
Supercomputer
LAN2LAN
LAN to LAN
Web server
Web browser
Repeater
PDA
General appliance
PC, blue
Mini VAX, blue
Directions Maps

8 Step Problem Solving

- Quality Symbol With Example Pdf File Download
- Quality Symbol In Pdf
- Manufacturing Quality Symbols Pdf
- Production Quality Symbols Pdf
- Production Drawing Symbols Pdf Download
- Process Flowchart | C N C Program Diagram Symbols Pdf File
- Mechanical Engineering | Mechnical Project Drawing Pdf File
- Quality Symbol Used In Mechanical Industries Pdf
- Download Pdf Files In Mechanical Symbols
- House of Quality | QFD house of quality | How to Create a House of ...
- Design elements - HOQ symbols | HOQ | HOQ matrix - Template | Hoq
- Quality Drawing Symbol
- Mechanical Related Quality Control Symbols And Their Meaning In ...
- Machining Drawing Symbols Pdf Download
- Star Network Topology | Cnc Machine Drawing Symbols Pdf File
- Quality Symbol For Cnc Machines
- House of Quality Matrix Software | Total Quality Management ...
- How to Save a Drawing as a Graphic File in ConceptDraw PRO ...
- Mechanical Drawing Symbols | Mathematics Symbols | Network ...
- Cnc Drawing Full Pdf Files Download