 Pie Charts
Pie Charts are extensively used in statistics and business for explaining data and work results, in mass media for comparison (i.e. to visualize the percentage for the parts of one total), and in many other fields. The Pie Charts solution for ConceptDraw DIAGRAM offers powerful drawing tools, varied templates, samples, and a library of vector stencils for simple construction and design of Pie Charts, Donut Chart, and Pie Graph Worksheets.
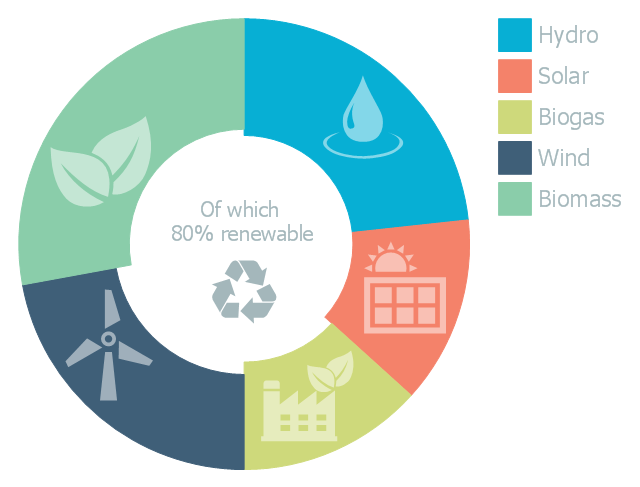
This doughnut chart sample illustrates the renewable energy sources. It was designed on the base of the Wikipedia file: Example of a doughnut chart.png.
[en.wikipedia.org/ wiki/ File:Example_ of_ a_ doughnut_ chart.png]
This file is licensed under the Creative Commons Attribution-ShareAlike 3.0 License. [creativecommons.org/ licenses/ by-sa/ 3.0/ ]
"Renewable energy is generally defined as energy that is collected from resources which are naturally replenished on a human timescale, such as sunlight, wind, rain, tides, waves, and geothermal heat. Renewable energy often provides energy in four important areas: electricity generation, air and water heating/ cooling, transportation, and rural (off-grid) energy services." [Renewable energy. Wikipedia]
The donut chart example "Renewable energy" was created using the ConceptDraw PRO diagramming and vector drawing software extended with the Pie Charts solutiton of the Graphs and Charts area in ConceptDraw Solution Park.
Donut chart
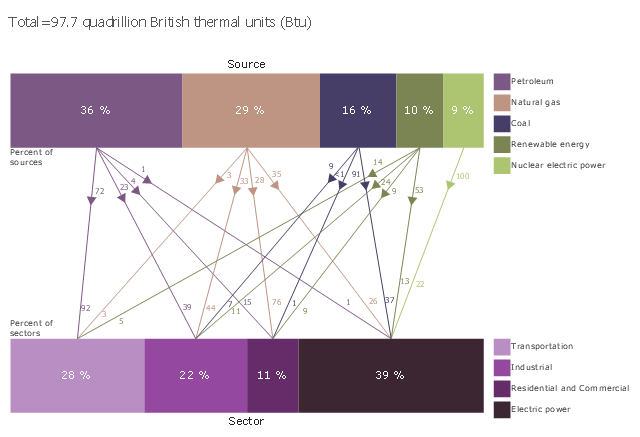
This divided bar diagram sample shows U.S. primary energy consumption by source and sector in 2015. It was designed using data from the chart in the webpage "U.S. Energy Facts Explained, Consumption & Production" on the website of the U.S. Energy Information Administration.
"Americans use many types of energy
Petroleum, natural gas, coal, renewable energy, and nuclear electric power are primary sources of energy. Electricity is a secondary energy source that is generated from primary sources of energy.
Energy sources are measured in different physical units: liquid fuels in barrels or gallons, natural gas in cubic feet, coal in short tons, and electricity in kilowatts and kilowatthours. In the United States, British thermal units (Btu), a measure of heat energy, is commonly used for comparing different types of energy to each other. In 2015, total U.S. primary energy consumption was about 97.7 quadrillion (1015, or one thousand trillion) Btu."
[eia.gov/ energyexplained/ index.cfm?page=us_ energy_ home]
The chart example "U.S. primary energy consumption by source and sector" was created using the ConceptDraw PRO diagramming and vector drawing software extended with the Divided Bar Diagrams solution from the Graphs and Charts area of ConceptDraw Solution Park.
Divided bar chart
 Manufacturing and Maintenance
Manufacturing and maintenance solution extends ConceptDraw DIAGRAM software with illustration samples, templates and vector stencils libraries with clip art of packaging systems, industrial vehicles, tools, resources and energy.
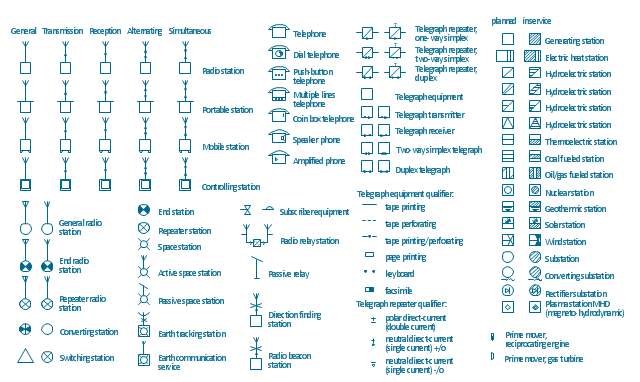
The vector stencils library "Stations" contains 110 symbols of communications equipment, generating, transmitting and receiving stations; substations; satellites; and power plants for power generation and distribution and radio relay systems.
"A power station (also referred to as a generating station, power plant, powerhouse or generating plant) is an industrial facility for the generation of electric power. At the center of nearly all power stations is a generator, a rotating machine that converts mechanical power into electrical power by creating relative motion between a magnetic field and a conductor. The energy source harnessed to turn the generator varies widely. It depends chiefly on which fuels are easily available, cheap enough and on the types of technology that the power company has access to. Most power stations in the world burn fossil fuels such as coal, oil, and natural gas to generate electricity, and some use nuclear power, but there is an increasing use of cleaner renewable sources such as solar, wind, wave and hydroelectric." [Power station. Wikipedia]
"Radio broadcasting is a one-way wireless transmission over radio waves intended to reach a wide audience. Stations can be linked in radio networks to broadcast a common radio format, either in broadcast syndication or simulcast or both. Audio broadcasting also can be done via cable radio, local wire television networks, satellite radio, and internet radio via streaming media on the Internet.
The signal types can be either analog audio or digital audio." [Radio broadcasting. Wikipedia]
The shapes example "Design elements - Stations" was drawn using the ConceptDraw PRO diagramming and vector drawing software extended with the Electrical Engineering solution from the Engineering area of ConceptDraw Solution Park.
Power and radio station symbols
"Consumption of energy resources, (e.g. turning on a light) requires resources and has an effect on the environment. Many electric power plants burn coal, oil or natural gas in order to generate electricity for energy needs. While burning these fossil fuels produces a readily available and instantaneous supply of electricity, it also generates air pollutants including carbon dioxide (CO2), sulfur dioxide and trioxide (SOx) and nitrogen oxides (NOx). Carbon dioxide is an important greenhouse gas which is thought to be responsible for some fraction of the rapid increase in global warming seen especially in the temperature records in the 20th century, as compared with tens of thousands of years worth of temperature records which can be read from ice cores taken in Arctic regions. Burning fossil fuels for electricity generation also releases trace metals such as beryllium, cadmium, chromium, copper, manganese, mercury, nickel, and silver into the environment, which also act as pollutants.
The large-scale use of renewable energy technologies would "greatly mitigate or eliminate a wide range of environmental and human health impacts of energy use". Renewable energy technologies include biofuels, solar heating and cooling, hydroelectric power, solar power, and wind power. Energy conservation and the efficient use of energy would also help." [Energy industry. Environmental impact. Wikipedia]
The Energy resources diagram example was created in the ConceptDraw PRO diagramming and vector drawing software using the Manufacturing and Maintenance solution from the Illustration area of ConceptDraw Solution Park.
Infographics

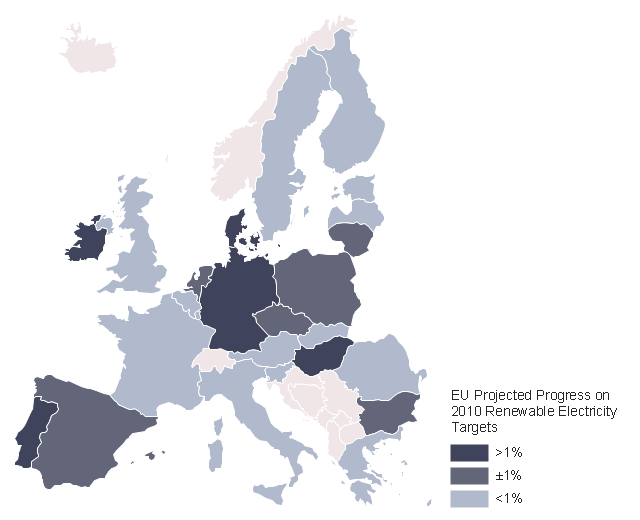
This example was created on the base of thematic map "2009 EU Renewable Electricity Share" from the article "European Union countries reach for higher renewable electricity generation" on the website of U.S. Energy Information Administration (EIA).
"Renewable generation includes hydropower, biomass, wind, solar, and geothermal. Nuclear power is not included." [www.eia.gov/ todayinenergy/ detail.cfm?id=2530]
"The countries of the European Union are the number two global leaders in the development and application of renewable energy. Promoting the use of renewable energy sources is important both to the reduction of the EU's dependence on foreign energy imports, and in meeting targets to combat global warming." [Renewable energy in the European Union. Wikipedia]
The thematic map example "EU countries map - Renewable electricity generation" was designed using the ConceptDraw PRO software extended with the Map of Germany solution from the Maps area of ConceptDraw Solution Park.
EU thematic map example
What is Gantt Chart (historical reference)
 *")
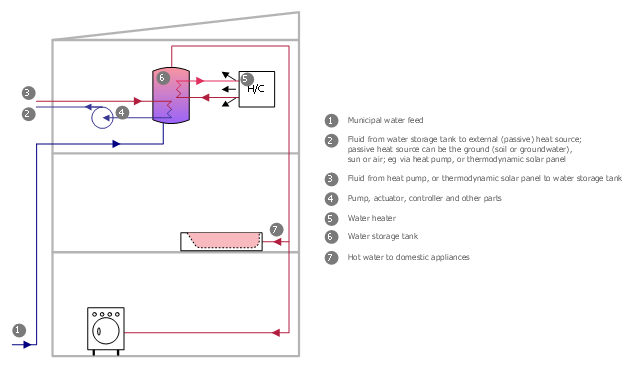
This plumbing and piping plan sample was designed on the base of the Wikimedia Commons file: Active Indirect Water Heater Diagram.svg.
[commons.wikimedia.org/ wiki/ File:Active_ Indirect_ Water_ Heater_ Diagram.svg]
This file is licensed under the Creative Commons Attribution-Share Alike 3.0 Unported license. [creativecommons.org/ licenses/ by-sa/ 3.0/ deed.en]
"Water heating is a thermodynamic process that uses an energy source to heat water above its initial temperature. Typical domestic uses of hot water include cooking, cleaning, bathing, and space heating. In industry, hot water and water heated to steam have many uses.
Domestically, water is traditionally heated in vessels known as water heaters, kettles, cauldrons, pots, or coppers. These metal vessels that heat a batch of water do not produce a continual supply of heated water at a preset temperature. Rarely, hot water occurs naturally, usually from natural hot springs. The temperature varies based on the consumption rate, becoming cooler as flow increases.
Appliances that provide a continual supply of hot water are called water heaters, hot water heaters, hot water tanks, boilers, heat exchangers, geysers, or calorifiers. These names depend on region, and whether they heat potable or non-potable water, are in domestic or industrial use, and their energy source. In domestic installations, potable water heated for uses other than space heating is also called domestic hot water (DHW).
Fossil fuels (natural gas, liquefied petroleum gas, oil), or solid fuels are commonly used for heating water. These may be consumed directly or may produce electricity that, in turn, heats water. Electricity to heat water may also come from any other electrical source, such as nuclear power or renewable energy. Alternative energy such as solar energy, heat pumps, hot water heat recycling, and geothermal heating can also heat water, often in combination with backup systems powered by fossil fuels or electricity." [Water heating. Wikipedia]
The plumbing plan example "Active indirect water heater diagram" was created using the ConceptDraw PRO diagramming and vector drawing software extended with the Plumbing and Piping Plans solution from the Building Plans area of ConceptDraw Solution Park.
Plumbing and piping plan
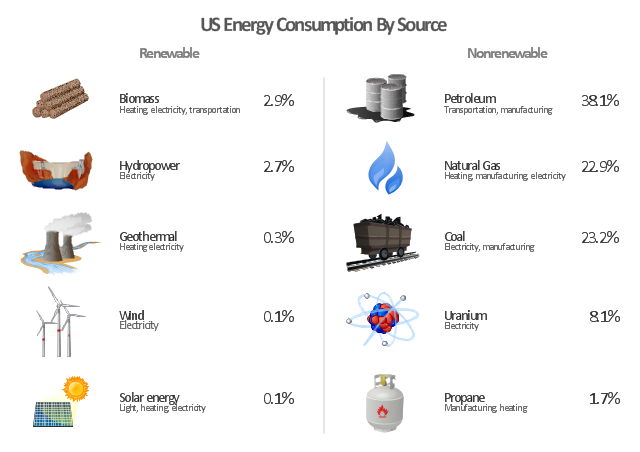
"The United States is the 800th largest energy consumer in terms of total use in 2010. ...
The majority of this energy is derived from fossil fuels: in 2010, data showed 25% of the nation's energy came from petroleum, 22% from coal, and 22% from natural gas. Nuclear power supplied 8.4% and renewable energy supplied 8%, which was mainly from hydroelectric dams although other renewables are included such as wind power, geothermal and solar energy." [Energy in the United States. Wikipedia]
The infographics example "U.S. energy consumption by source" was created in the ConceptDraw PRO diagramming and vector drawing software using the Manufacturing and Maintenance solution from the Illustration area of ConceptDraw Solution Park.
Infographics
 Divided Bar Diagrams
The Divided Bar Diagrams Solution extends the capabilities of ConceptDraw DIAGRAM with templates, samples, and a library of vector stencils for drawing high impact and professional Divided Bar Diagrams and Graphs, Bar Diagram Math, and Stacked Graph.
Mesh Network Topology Diagram

How to draw Metro Map style infographics? (London)
</i> *")
Electrical Symbols — Stations

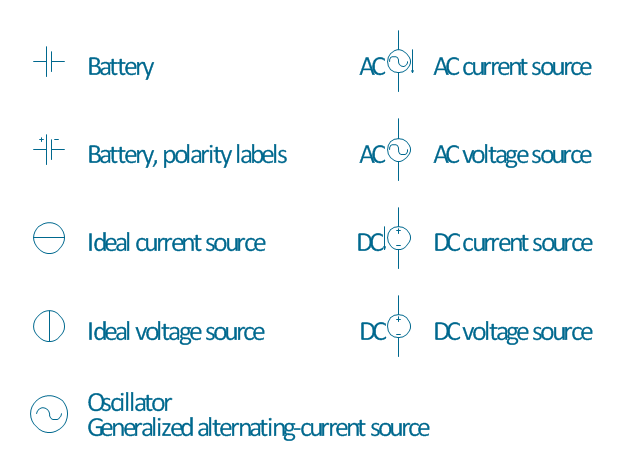
The vector stencils library "Power sources" contains 9 element symbols of power sources and batteries for drawing the electrical schematics and electronic circuit diagrams.
"A power supply is a device that supplies electric power to an electrical load. The term is most commonly applied to electric power converters that convert one form of electrical energy to another, though it may also refer to devices that convert another form of energy (mechanical, chemical, solar) to electrical energy. A regulated power supply is one that controls the output voltage or current to a specific value; the controlled value is held nearly constant despite variations in either load current or the voltage supplied by the power supply's energy source.
Every power supply must obtain the energy it supplies to its load, as well as any energy it consumes while performing that task, from an energy source. Depending on its design, a power supply may obtain energy from:
(1) Electrical energy transmission systems. Common examples of this include power supplies that convert AC line voltage to DC voltage.
(2) Energy storage devices such as batteries and fuel cells.
(3) Electromechanical systems such as generators and alternators.
(4) Solar power." [Power supply. Wikipedia]
The shapes example "Design elements - Power sources" was drawn using the ConceptDraw PRO diagramming and vector drawing software extended with the Electrical Engineering solution from the Engineering area of ConceptDraw Solution Park.
Power source symbols
The vector stencils library "Resources and energy" contains 19 clipart images for drawing illustrations on resources and energy.
"Natural resources occur naturally within environments that exist relatively undisturbed by humanity, in a natural form. A natural resource is often characterized by amounts of biodiversity and geodiversity existent in various ecosystems.
Natural resources are derived from the environment. Some of them are essential for our survival while most are used for satisfying our wants. Natural resources may be further classified in different ways.
Natural resources are materials and components (something that can be used) that can be found within the environment. Every man-made product is composed of natural resources (at its fundamental level). A natural resource may exist as a separate entity such as fresh water, and air, as well as a living organism such as a fish, or it may exist in an alternate form which must be processed to obtain the resource such as metal ores, oil, and most forms of energy." [Natural resource. Wikipedia]
The clip art example "Resources and energy - Vector stencils library" was created in ConceptDraw PRO diagramming and vector drawing software using the Manufacturing and Maintenance solution from the Illustration area of ConceptDraw Solution Park.
Human resources

Batteries

Wind turbine

Transmission tower

Natural gas burner

Solar panel

Lightning

Ionizing radiation hazard sign

High voltage symbol

Atom

Incandescent light bulb

Oil barrels

Power station

Wood

Perpetuum mobile

Hydroelectric dam

Liquefied petroleum gas

Natural gas

Minecart with coal

Electrical Symbols — Electron Tubes

Electrical Symbols — Transmission Paths

Electrical Symbols — Thermo

Electrical Symbols — Lamps, Acoustics, Readouts

- Renewable energy | Pie Charts | Electrical Symbols — Power ...
- Examples Of Non Renewable Energy
- EU countries map - Renewable electricity generation | Energy ...
- Pie Charts | Manufacturing and Maintenance | Energy resources ...
- Design elements - Power sources | Manufacturing and Maintenance ...
- Energy resources diagram | Manufacturing and Maintenance ...
- Pie Charts | Resources and energy - Vector stencils library | Pyramid ...
- Explain Alternative Energy Source With Suitable Flow Chart
- Non Renewable Resources Graph
- Types of Flowcharts | Energy resources diagram | Pie Charts | Solar ...
- Types of Flowcharts | Energy resources diagram | Pie Charts | Solar ...
- Energy resources diagram | Network Diagram Software | Network ...
- Energy resources diagram | Example Renewable Resources
- Resources and energy - Vector stencils library | Design elements ...
- Energy Pyramid Diagram | Energy resources diagram | | Energy
- Renewable energy | Resources and energy - Vector stencils library ...
- Pie Charts | Human Resource Development | Non Renewable ...
- Renewable energy | Ecology pictograms - Vector stencils library ...
- Energy resources diagram | U.S. energy consumption by source ...
- Energy resources diagram | Electrical Symbols — Power Sources ...