, t chart, decision matrix, decision tree analysis") Decision Making
Decision Making
The Decision Making solution offers the set of professionally developed examples, powerful drawing tools and a wide range of libraries with specific ready-made vector decision icons, decision pictograms, decision flowchart elements, decision tree icons, decision signs arrows, and callouts, allowing the decision maker (even without drawing and design skills) to easily construct Decision diagrams, Business decision maps, Decision flowcharts, Decision trees, Decision matrix, T Chart, Influence diagrams, which are powerful in questions of decision making, holding decision tree analysis and Analytic Hierarchy Process (AHP), visual decomposition the decision problem into hierarchy of easily comprehensible sub-problems and solving them without any efforts.
How To Make the Right Decision in Projects


HelpDesk
How to Draw a Decision-Making Diagram

Decision Making Software For Small Business

Marketing Flow Chart

Basic Flowchart Symbols and Meaning


Decision Maker

Block Diagram Software

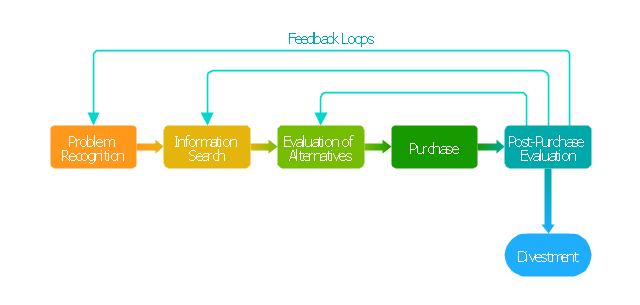
"Decision-making can be regarded as the cognitive process resulting in the selection of a belief and/ or a course of action among several alternative possibilities. Every decision-making process produces a final choice that may or may not prompt action. ...
Decision-making can also be regarded as a problem-solving activity terminated by a solution deemed to be satisfactory. It is, therefore, a reasoning or emotional process which can be rational or irrational and can be based on explicit assumptions or tacit assumptions. Most decisions are followed by some form of cost-benefit analysis. Rational choice theory encompasses the notion that people try to maximize benefits while minimizing costs.
Some have argued that most decisions are made unconsciously, if not involuntarily. Jim Nightingale, author of Think Smart – Act Smart, states that "we simply decide without thinking much about the decision process. ...
A major part of decision-making involves the analysis of a finite set of alternatives described in terms of evaluative criteria. Information overload occurs when there is a substantial gap between the capacity of information and the ways in which people may or can adapt."" [Decision-making. Wikipedia]
The block diagram example "Customer decision making" was created using the ConceptDraw PRO diagramming and vector drawing software extended with the Block Diagrams solution from the area "What is a Diagram" of ConceptDraw Solution Park.
Block diagram
Decision Making


PDPC

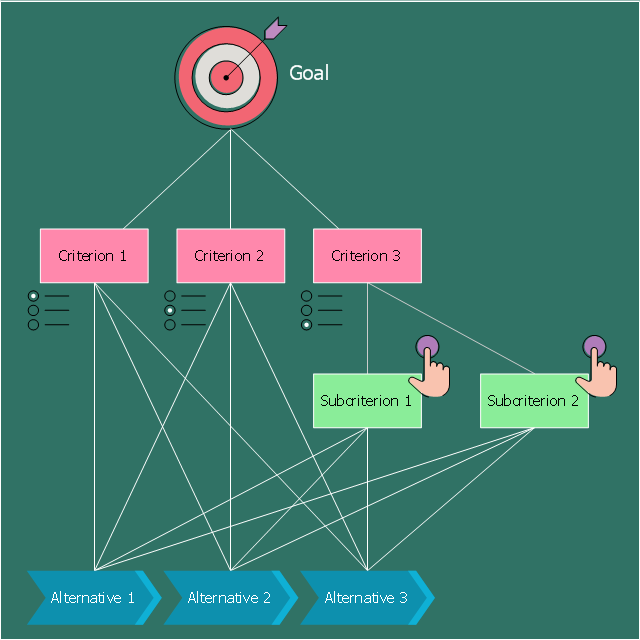
This diagram example illustrates analytic hierarchy process technique for decision making.
It was designed on the base of Wikimedia Commons file: AHPHierarchy02.png. [commons.wikimedia.org/ wiki/ File:AHPHierarchy02.png]
"The analytic hierarchy process (AHP) is a structured technique for organizing and analyzing complex decisions, based on mathematics and psychology. It was developed by Thomas L. Saaty in the 1970s and has been extensively studied and refined since then.
It has particular application in group decision making, and is used around the world in a wide variety of decision situations, in fields such as government, business, industry, healthcare, shipbuilding and education." [Analytic hierarchy process. Wikipedia]
The decision diagram example "Analytic hierarchy process" was designed using ConceptDraw software extended with Decision Making solution from Management area of ConceptDraw Solution Park.
Decision diagram example
Pyramid Diagram

Workflow Diagram

Basic Flowchart Images. Flowchart Examples

Business Productivity - Management

How Do Fishbone Diagrams Solve Manufacturing Problems

Samples of Flowchart

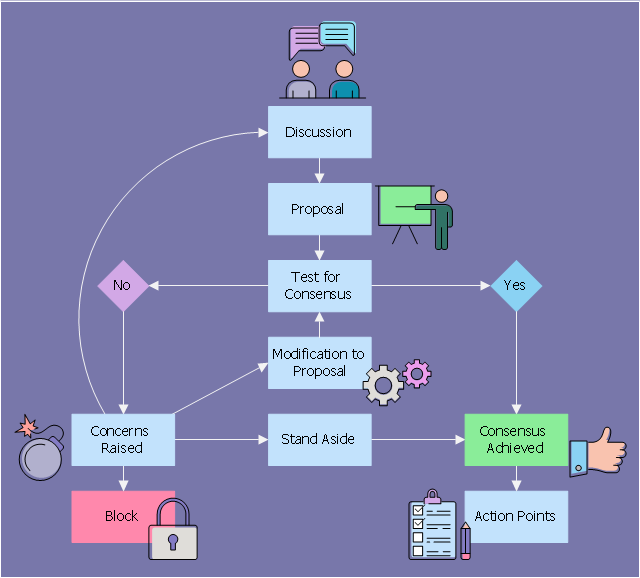
This flowchart example illustrates the consensus based decision-making.
It was designed on the base of Wikimedia Commons file: Consensus flow chart.svg. [commons.wikimedia.org/ wiki/ File:Consensus_ flow_ chart.svg]
"Consensus decision-making is a group decision-making process in which group members develop, and agree to support a decision in the best interest of the whole. Consensus may be defined professionally as an acceptable resolution, one that can be supported, even if not the "favourite" of each individual. ... Consensus decision-making is thus concerned with the process of deliberating and finalizing a decision, and the social, economic, legal, environmental and political effects of applying this process." [Consensus decision-making. Wikipedia]
This file is licensed under the Creative Commons Attribution-Share Alike 3.0 Unported license. [creativecommons.org/ licenses/ by-sa/ 3.0/ deed.en]
The decision diagram example "Consensus flow chart" was designed using ConceptDraw software extended with Decision Making solution from Management area of ConceptDraw Solution Park.
Decision diagram example
Applications

- Decision Tree In Software Engineering With Example
- Examples Of Decision Making Diagrams
- Decision Making | PDPC | Risk Diagram ( Process Decision Program ...
- Decision tree flowchart | Decision Making | Decision Tree Analysis ...
- Block diagram - Customer decision making | How to Create an ...
- Diagram For Decision Making Process
- Basic Flowchart Images. Flowchart Examples | Process Flowchart ...
- Decision Making | Pyramid Diagram | Workflow Diagram | Decision ...
- Block diagram - Customer decision making | Block Diagrams ...
- Draw A Flow Chart On Mobile Phone Purchase Decision Making
- Decision Tree Analysis | How to Draw a Decision - Making Diagram ...
- Block diagram - Customer decision making | How to Draw Business ...
- Buying Decision Process Flow Chart
- Decision Making | Basic Flowchart Symbols and Meaning | Pyramid ...
- Decision Making | Decision Tree Analysis | Decision tree flowchart ...
- Multiple Decision Point Flow Chart
- Strategy Decision Making Process Diagrams
- Online Decision Making Process Block Diagrams
- Basic Flowchart Symbols and Meaning | Decision Making Software ...
- Block diagram - Customer decision making | Block Diagrams | Block ...