This site uses cookies. By continuing to browse the ConceptDraw site you are agreeing to our Use of Site Cookies.

Gant Chart in Project Management

Gant Chart is a graphical representation of tasks as segments on a time scale. It helps plan and monitor project development or resource allocation. The horizontal axis is a time scale, expressed either in absolute or relative time.
what is software project management

Gantt chart examples

All Gantt charts were made using ConceptDraw PROJECT. ConceptDraw PROJECT works both on Windows and Mac OS X. It allows to schedule a voluntary number of projects in a single Workspace document and lets easily share tasks and resources among them. ConceptDraw PROJECT shares files among Windows and Mac OS X.

Business Tools Perceptual Mapping

This sample shows the Perceptual map. It was created in ConceptDraw DIAGRAM diagramming and vector drawing software using the Matrices Solution from the Marketing area of ConceptDraw Solution Park.
Perception Mapping helps organizations measure and transform all aspects of their business, people and culture. Perception Mapping allows to represent the complex relationships graphically, helps identify potential problems of the organization and make the best decisions.

Target Diagram

Target Diagram is a convenient and visual way of presentation information which is popular and widely used in marketing, business and economics. ConceptDraw DIAGRAM diagramming and vector drawing software extended with Target and Circular Diagrams solution from the Marketing area of ConceptDraw Solution Park is ideal for fast and easy drawing a Target Diagram.

Marketing Infographics

Marketing Infographics is a very popular tool that allows to represent the complex data, knowledge, and other marketing information in a simple, visual and attractive graphical form. But how to draw Marketing Infographics simply and quickly? ConceptDraw DIAGRAM diagramming and vector drawing software extended with unique Marketing Infographics Solution from the Business Infographics Area will help you design marketing infographics without efforts.

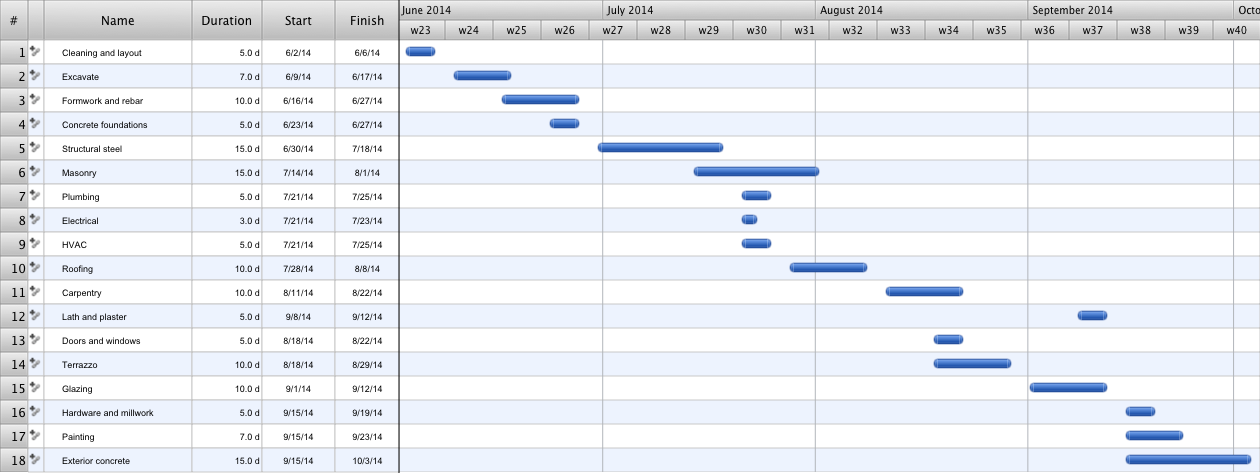
Construction Project Chart Examples

ConceptDraw PROJECT provides a set of construction Gantt chart examples. Project manager requires task tracking, and project examples best approach to start. Make your project applying one of our ready-made examples.

Pyramid Chart Examples

Seeking a solution for maximizing the efficiencies throughout the pyramid charts? ConceptDraw examples to help you create pyramid diagrams quickly.

How to Create Presentation of Your Project Gantt Chart

During the planning, discussing and execution of a project you may need to prepare a presentation using project views such as the Gantt Chart, Multiproject Dashboard or Resource Usage View. It’s easy do with ConceptDraw PROJECT!

Create Response Charts

Visual navigation through the stages of a response process helps you locate specific actions to be taken via Action Mind Maps. Use ConceptDraw DIAGRAM and ConceptDraw MINDMAP for organize the process of response for interactions occurring in social media.

Business Process Mapping — How to Map a Work Process

ConceptDraw DIAGRAM is a world-class diagramming platform that lets you display, communicate, and present dynamically. It′s powerful enough to draw everything from basic flowcharts to complex engineering schematics.
Video tutorials on ConceptDraw products. Try it today!

What Constitutes a Project?

Separated into categories of Basic, Intermediate, and Advanced categories, the new instructional videos about ConceptDraw PROJECT cover a huge breadth of topics. Users new to ConceptDraw PROJECT will find the Basic lessons an essential platform for familiarizing themselves with the programs′s functions. This video lesson is the first in Basic lessons series.
what is software project management

Swot Analysis Examples for Mac OSX

SWOT Analysis solution from ConceptDraw Solution Park extends ConceptDraw MINDMAP and ConceptDraw DIAGRAM software with easy-to-use SWOT Analysis tools for Mac OSX and Windows.
HelpDesk

How to Create a Gantt Chart for Your Project

Instruction on how to create Gantt chart using ConceptDraw PROJECT software.
Gant Chart is a graphical representation of tasks as segments on a time scale. It helps plan or overlapping.

Remote Projects in Corporate Strategy

Communication is the main challenge and the key success factor for organizational project management in company with remote projects. Communicating visually via Skype you bring all projects together to achieve corporate goals.

Business Board Org Chart

This sample was created in ConceptDraw DIAGRAM diagramming and vector drawing software using the Organizational Charts Solution from the Software Development area of ConceptDraw Solution Park.
This sample shows the organizational chart in the field of Architect Engineering. Create your own orgchart professional drawings using ConceptDraw.