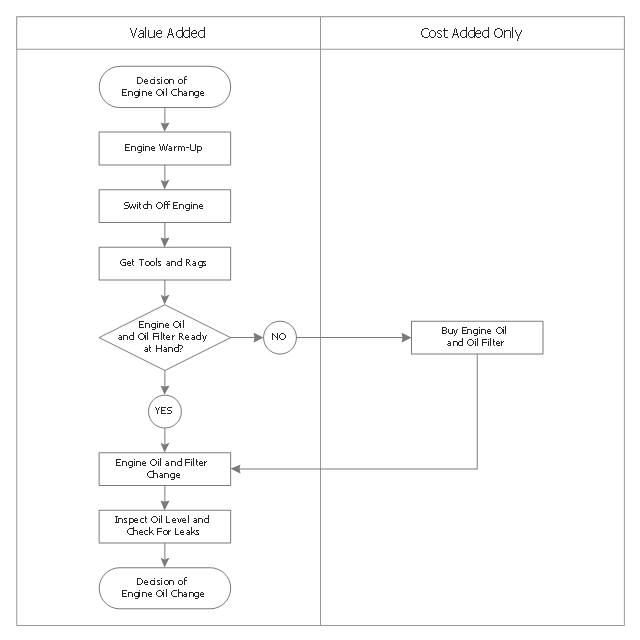
This opportunity flowchart sample shows the steps involved in replacing engine oil process. The opportunity flowcharts are used in business process improvement to identify process steps which might be improved.
"Business process improvement (BPI) is a systematic approach to help an organization optimize its underlying processes to achieve more efficient results. ...
An organization is only as good as its processes. To be able to make the necessary changes in an organization, one needs to understand the key processes of the company. Rummler and Brache suggested a model for running a Process Improvement and Management project (PI&M), containing the following steps:
1. Identify the process to be improved (based on a critical business issue): The identification of key processes can be a formal or informal exercise. The management team might select processes by applying a set of criteria derived from strategic and tactical priorities, or process selection is based on obvious performance gaps. It is important is to select the process(es) which have the greatest impact on a competitive advantage or customer requirement.
2. Develop the objective(s) for the project based on the requirements of the process: The focus might be on quality improvement, productivity, cost, customer service or cycle time. The goal is however always the same; to get the key process under control.
3. Select the members of the cross-functional team: A horizontal (cross-functional) analysis is carried out by a team composed of representatives of all functions involved in the process. While a consultant or in-house staff person can do the job, the quality of the analysis and the commitment to change is far greater with a cross-functional team.
4. Document the current process by creating a flowchart or "organization map": Describe the process regarding the Organizational level, the Process level and the Job/ Performer level according to Rummler. Develop a cross-functional process map for the process.
5. Identify "disconnects" in the process: “Disconnections” are everything that inhibit the efficiency and effectiveness of the process. The identification should be categorized into the three levels: The Organizational level, the Process level and the Job/ Performer level.
6. Recommend changes (organizational, in the process or in its execution): Categorize and prioritize the main problems and possibilities, evaluate alternative solutions. Develop a cross-functional process map for the recommended process.
7. Establish process and sub-process measures: The process measures should reflect the objectives of the project.
8. Implement the improvements." [Business process improvement. Wikipedia]
The swim lane diagram example "Process flowchart - Replacing engine oil" was created using the ConceptDraw PRO diagramming and vector drawing software extended with the Process Flowcharts solution from the Business Processes area of ConceptDraw Solution Park.
Swim lane diagram
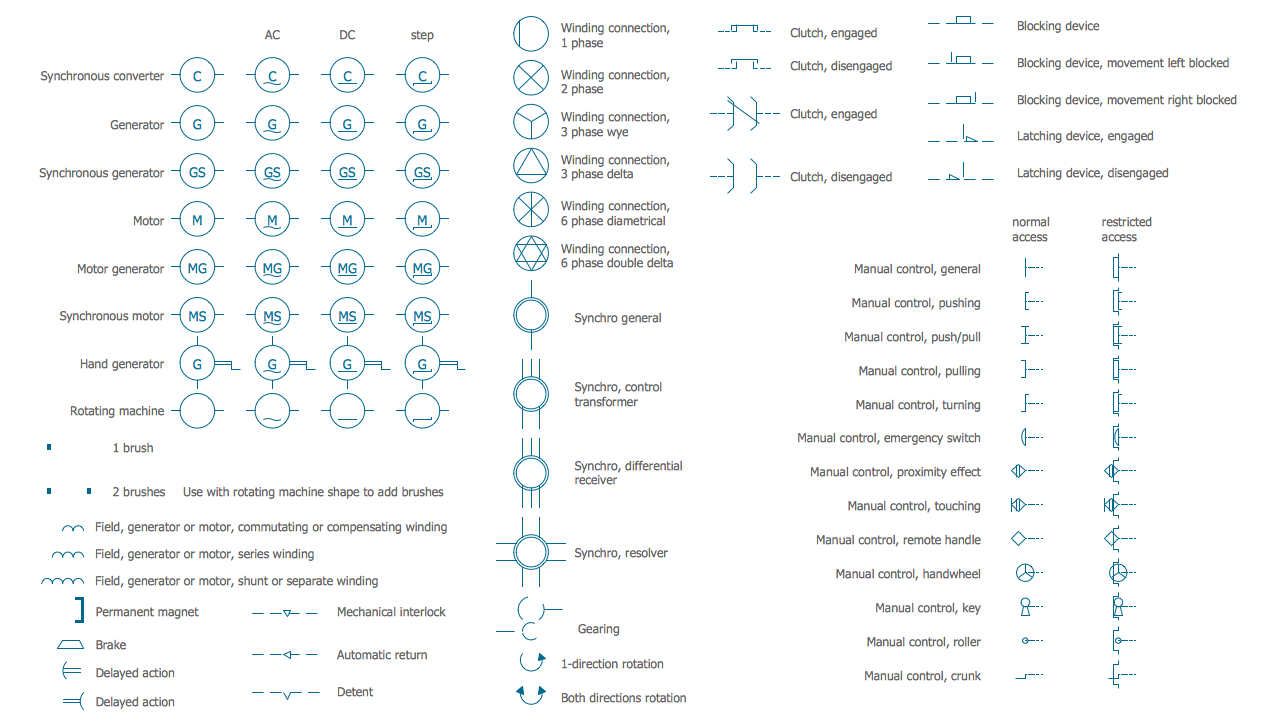
Electrical Symbols — Rotating Equipment
Best Diagramming


The Building Blocks Used in EPC Diagrams

Network Topologies


Basic Diagramming

Local area network (LAN). Computer and Network Examples
 diagram")

 Cross-Functional Flowcharts
Cross-functional flowcharts are powerful and useful tool for visualizing and analyzing complex business processes which requires involvement of multiple people, teams or even departments. They let clearly represent a sequence of the process steps, the order of operations, relationships between processes and responsible functional units (such as departments or positions).
Business Diagram Software


 Process Flowcharts
This solution extends ConceptDraw DIAGRAM software with templates, samples, and library of vector shapes for drawing the Process Flowcharts.
Mechanical Drawing Symbols

Project — Working With Tasks

 Computer Network Diagrams
Computer Network Diagrams solution extends ConceptDraw DIAGRAM software with samples, templates and libraries of vector icons and objects of computer network devices and network components to help you create professional-looking Computer Network Diagrams, to plan simple home networks and complex computer network configurations for large buildings, to represent their schemes in a comprehensible graphical view, to document computer networks configurations, to depict the interactions between network's components, the used protocols and topologies, to represent physical and logical network structures, to compare visually different topologies and to depict their combinations, to represent in details the network structure with help of schemes, to study and analyze the network configurations, to communicate effectively to engineers, stakeholders and end-users, to track network working and troubleshoot, if necessary.
Program to Make Flow Chart

How to Report Task's Execution with Gantt Chart

- HVAC Plans | How to Create a HVAC Plan | Block diagram ...
- Car Engine Basic Diagram And Block Diagram
- Block diagram - Automotive HVAC system | HVAC Marketing Plan ...
- Block diagram - Automotive HVAC system | HVAC Plans | Cable TV ...
- Mechanical Engine Diagram
- Block diagram - Automotive HVAC system | HVAC Plans | HVAC ...
- Taxi Service Data Flow Diagram DFD Example | Taxi order process ...
- Black And White Car Diagram
- Replacing engine oil - Opportunity flowchart | Opportunity flowchart ...
- AWS Analytics - Vector stencils library | Design elements - AWS ...
- Road Transport - Design Elements | Aerospace and Transport | UML ...
- Cluster Diagram
- Entity-Relationship Diagram (ERD) with ConceptDraw PRO | UML ...
- Replacing engine oil - Opportunity flowchart | Cross Functional ...
- Technical Drawing Software | How to Create a Mechanical Diagram ...
- Block diagram - Gap model of service quality | Block Diagram ...
- Switch Cisco Icon Black
- Mathematical Diagrams | Mathematics Symbols | Mathematics ...
- Process Flowchart | Piping and Instrumentation Diagram Software ...
- Cluster Architecture Diagram