How to Present a Social Media Response Plan DFD to Your Team

Cause and Effect Analysis


PROBLEM ANALYSIS. Root Cause Analysis Tree Diagram

Emergency Plan Template

How to Connect Social Media DFD Flowchart with Action Maps

What Is an Action Mind Map

Basic Flowchart Symbols and Meaning


Authority Matrix Diagram Software

Flow chart Example. Warehouse Flowchart


How to Create a Social Media DFD Flowchart

How to Create a Line Chart

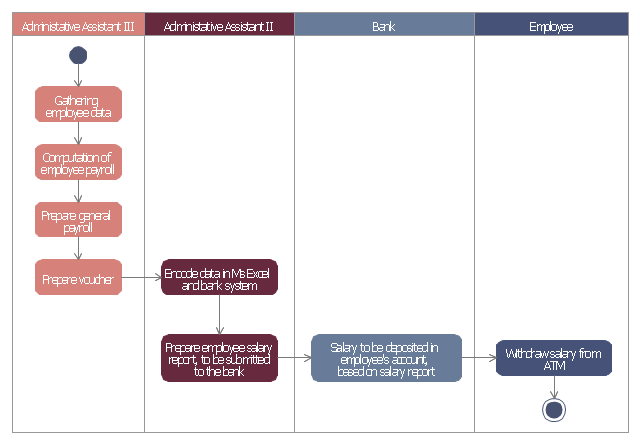
This example of automated payroll management system UML activity diagram was created on the base of figure on the webpage "Automated payroll management system" from ethelmandane.wikispaces.com.
"In the Philippines and in other foreign countries the government has a trend to embrace automation for process efficiency. One of the processes that are being automated is the payroll process. Payroll is the total amount required to pay workers and employees during a week, month or other period.
One of the government offices that desires to automate their payroll system is the NSO Camarines Sur which is located 2nd Floor MMCN Building, Panganiban Avenue, Naga City. The National Statistics Office (NSO) envisions to be recognized as a world-class provider of statistical and civil registration products and services and lives with its mission to produces and provides quality statistical and civil registration products and services. ...
The project seeks to create an Information System Plan for an Automated Payroll Management System. ...
The creation of the Information System Plan will benefit the accounting section of the organization. Specifically it is significant to:
1. Administrative Assistants. It will help to lessen time and effort in preparing and computing the salary of the employee.
2. NSO. It will help the organization to be more productive and efficient."
[ethelmandane.wikispaces.com/ ]
This file is licensed under a Creative Commons Attribution Share-Alike 3.0 License. [creativecommons.org/ licenses/ by-sa/ 3.0/ ]
This UML activity diagram example modeling the automated payroll management system using automated teller machine (ATM) was created using the ConceptDraw PRO diagramming and vector drawing software extended with the ATM UML Diagrams solution from the Software Development area of ConceptDraw Solution Park.
UML activity diagram of automated payroll management system using ATM
Map of Germany

How to Use the ″Online Store PR Campaign″ Sample

- Emergency Plan | Fire Exit Plan | Emergency Action Plan Template ...
- Emergency Plan | Emergency Action Plan Template | Fire Exit Plan ...
- Interior Design Office Layout Plan Design Element | How to Draw a ...
- Emergency Plan | Fire safety equipment - Vector stencils library ...
- Personal Planning
- How to Draw a Floor Plan for Your Office | Interior Design Office ...
- Normal (Gaussian) distribution graph | Design elements - Frequency ...
- Office Layout Plans | Office Layout | How to Draw a Floor Plan for ...
- HR workflow - Vector stencils library | Program Evaluation and ...
- Emergency Plan | Fire Exit Plan . Building Plan Examples | How To ...
- Emergency Plan | Fire and Emergency Plans | How To Create ...
- Interior Design Office Layout Plan Design Element | Office Layout ...
- Workflow Planning
- How To Draw Building Plans | How to Add a Floor Plan to a MS ...
- Emergency Plan | Fire Evacuation Plan Template | How To Create ...
- Emergency Plan | Fire Exit Plan . Building Plan Examples | How To ...
- Example Of Fire Safety Plan
- Interior Design Office Layout Plan Design Element | Office Ideas ...
- Emergency Plan | Fire and Emergency Plans | How To Create ...
- Emergency Plan