Process Flow Diagram Symbols

Value Stream Mapping Symbols

Flowchart Symbols Accounting. Activity-based costing (ABC) flowchart
 flowchart *")
Basic Flowchart Symbols and Meaning


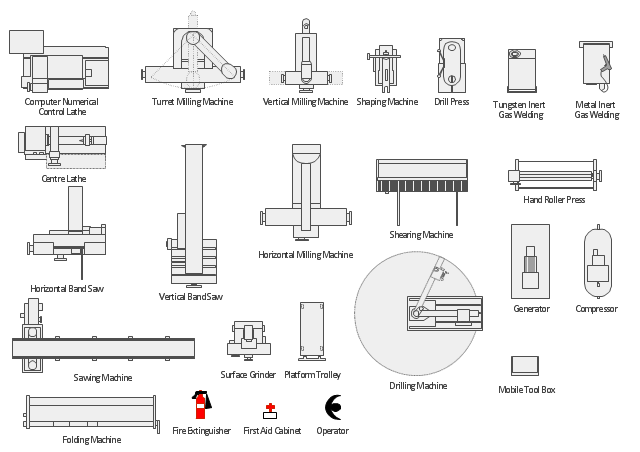
The vector stencils library "Machines and equipment" contains 24 symbols of industrial machines and equipment.
Use the design elements library "Machines and equipment" for drawing plant interior design plans, manufacturing equipment layouts and factory floor plans using the ConceptDraw PRO diagramming and vector drawing software.
"Manufacturing is the production of goods for use or sale using labor and machines, tools, chemical and biological processing, or formulation. The term may refer to a range of human activity, from handicraft to high tech, but is most commonly applied to industrial production, in which raw materials are transformed into finished goods on a large scale.
Modern manufacturing includes all intermediate processes required for the production and integration of a product's components. Some industries, such as semiconductor and steel manufacturers use the term fabrication instead.
The manufacturing sector is closely connected with engineering and industrial design." [Manufacturing. Wikipedia]
The shapes library "Machines and equipment" is included in the Plant Layout Plans solution from the Building Plans area of ConceptDraw Solution Park.
Machines and equipment symbols
Samples of Flowchart

ERD Symbols and Meanings


Cisco Network Icons

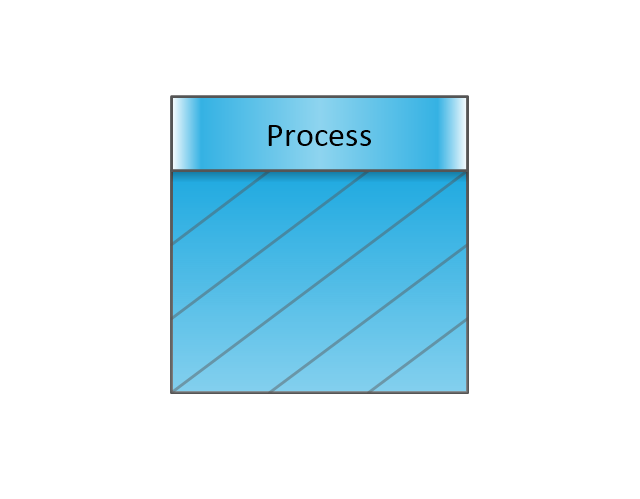
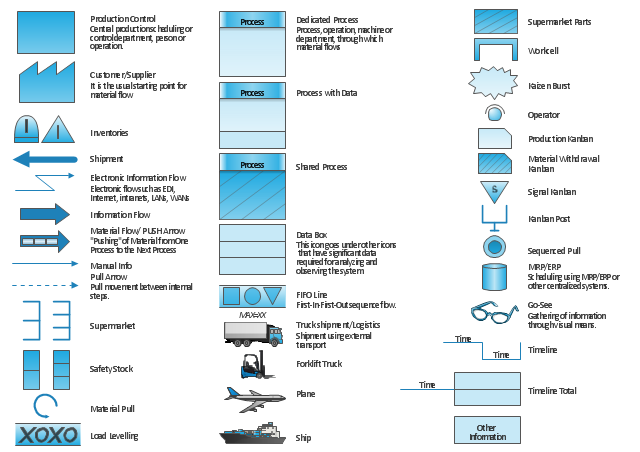
The vector stencils library "Value stream mapping" contains 43 VSM symbols.
Use it for drawing value stream maps in the ConceptDraw PRO diagramming and vector drawing software extended with the Value Stream Mapping solution from the Quality area of ConceptDraw Solution Park.
www.conceptdraw.com/ solution-park/ business-value-stream-mapping
Use it for drawing value stream maps in the ConceptDraw PRO diagramming and vector drawing software extended with the Value Stream Mapping solution from the Quality area of ConceptDraw Solution Park.
www.conceptdraw.com/ solution-park/ business-value-stream-mapping
Inventory
Inventory

Information Flow
Shipment
Shipment

Material Flow
Material Pull

FIFO Line
Truck shipment/Logistics
Customer/Supplier
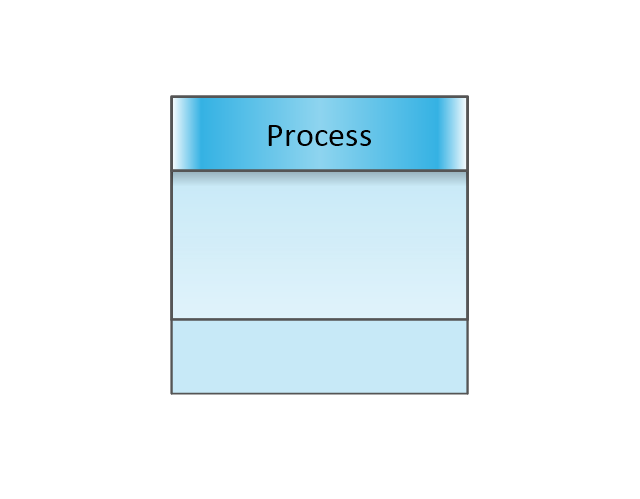
Dedicated Process

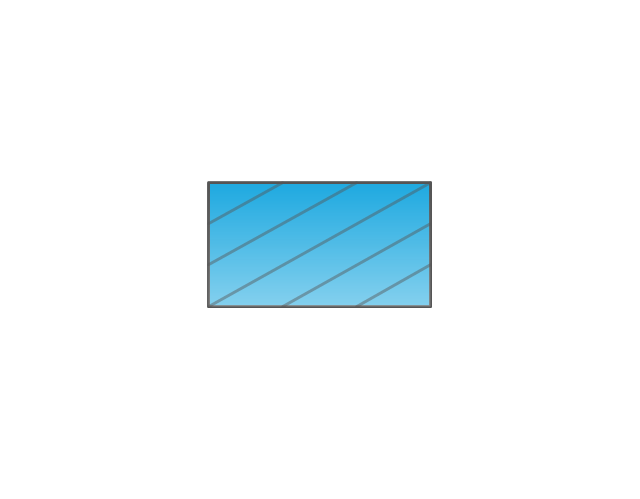
Shared Process
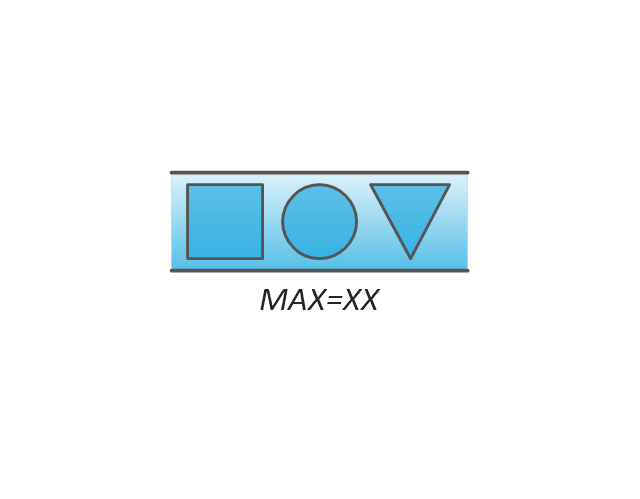
Supermarket Parts
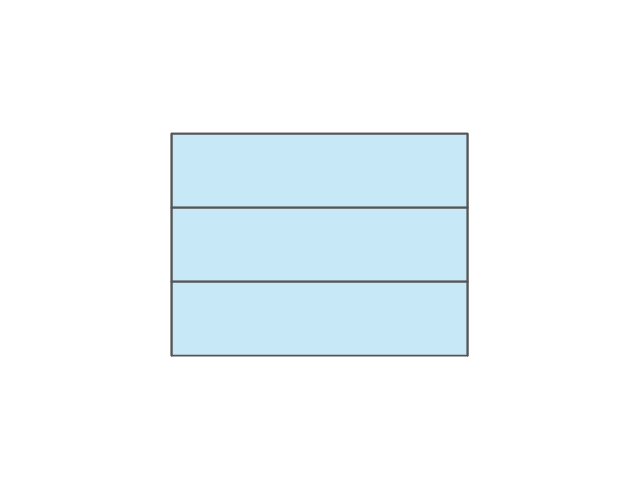
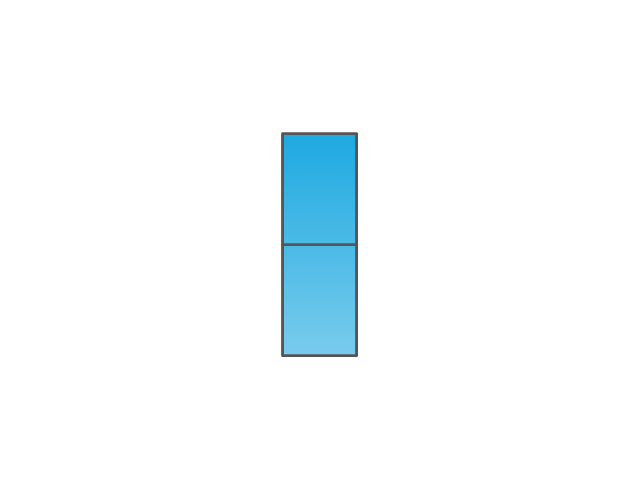
Data Box
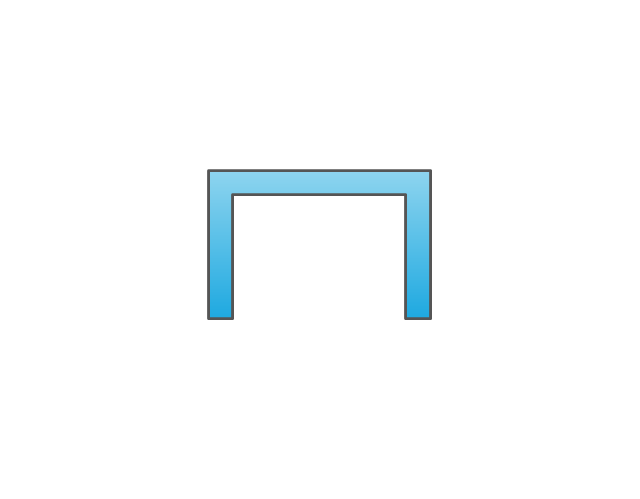
Workcell
Kaizen Burst

Operator

Other
Production Control
Manual Info
Electronic Information Flow
Production Kanban

Withdrawal Kanban
Signal Kanban
Kanban Post

Sequenced Pull

Load Levelling
MRP/ERP
Go-See

Pull Arrow
Manual Info
Pull Arrow
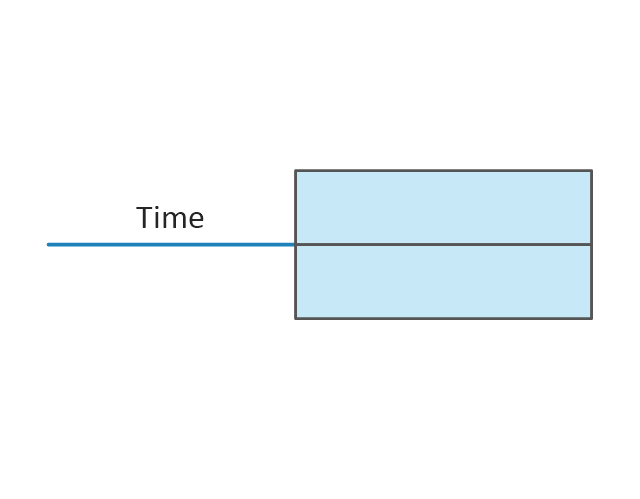
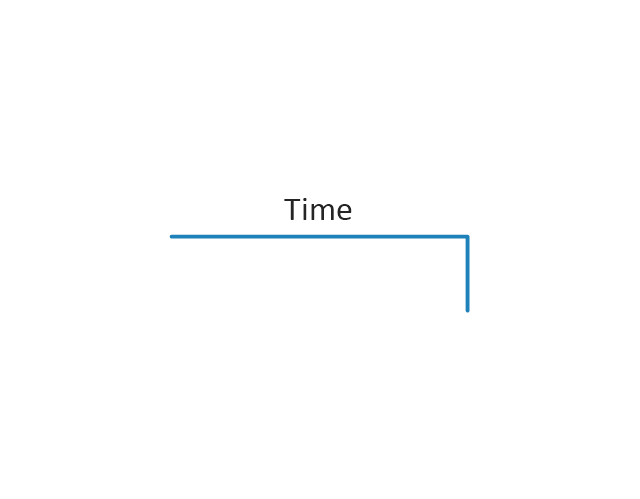
Timeline Total
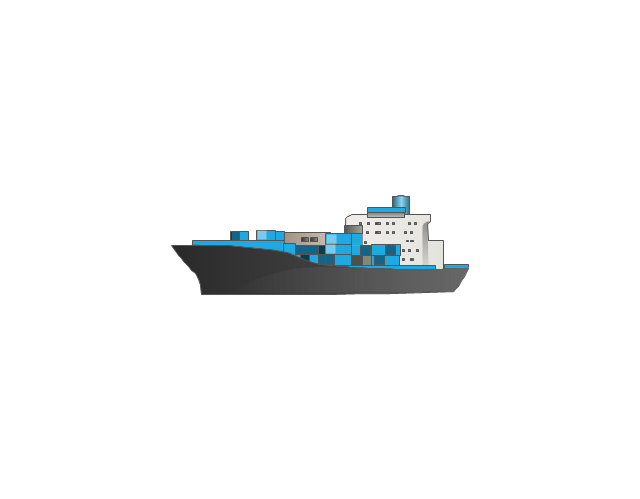
Ship
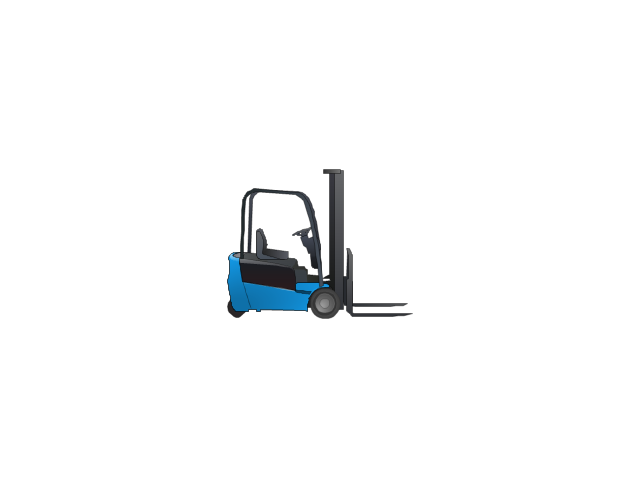
Forklift Truck
Plane

Process with Data
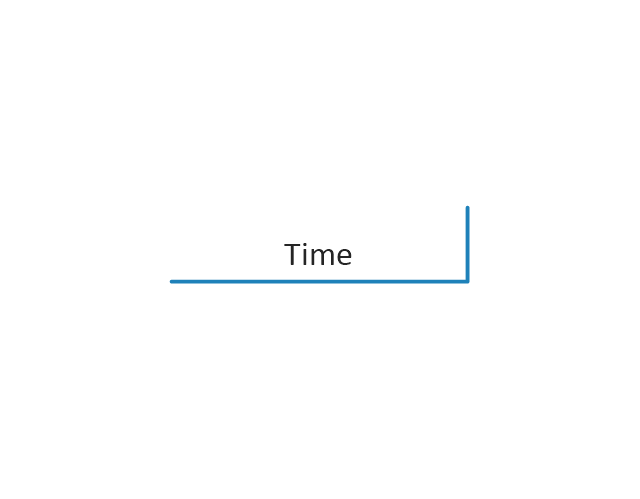
Timeline
Timeline
Supermarket, 2

Supermarket, 3

Safety stock, 2
Safety stock, 3
Bar Diagrams for Problem Solving. Create manufacturing and economics bar charts with Bar Graphs Solution

HR Flowchart Symbols

Business Process Flowchart Symbols

Electrical Symbols — Transformers and Windings

Electrical Symbols — Switches and Relays

"Value stream mapping usually employs standard symbols to represent items and processes, therefore knowledge of these symbols is essential to correctly interpret the production system problems." [Value stream mapping. Wikipedia]
The vector stencils library Value stream mapping contains 43 symbols for drawing the value stream mapping diagrams using the ConceptDraw PRO diagramming and vector drawing software.
The example "Design elements - Value stream mapping diagram" is included in the Value Stream Mapping solution from the Quality area of ConceptDraw Solution Park.
VSM symbols
Data Flow Diagram Symbols. DFD Library

Cisco Optical. Cisco icons, shapes, stencils and symbols

Flowchart design. Flowchart symbols, shapes, stencils and icons


An Event-driven Process Chain (EPC) - flowchart used for business process modelling
 - <br>flowchart used for business process modelling *")
The vector stencils library "Workflow diagrams" contains 54 symbol icons of workflow diagrams.
Use these clipart to represent information flow, automation of business processes, business process re-engineering, accounting, management, and human resources tasks in industry, business, and manufacturing.
"The term workflow is more commonly used in particular industries, such as printing and professional domains, where it may have particular specialized meanings.
(1) Processes: A process is a more general notion than workflow and can apply to physical or biological processes, for instance; whereas a workflow is typically a process or collection of processes described in the context of work, such as all processes occurring in a machine shop.
(2) Planning and scheduling: A plan is a description of the logically necessary, partially ordered set of activities required to accomplish a specific goal given certain starting conditions. A plan, when augmented with a schedule and resource allocation calculations, completely defines a particular instance of systematic processing in pursuit of a goal. A workflow may be viewed as an (often optimal or near-optimal) realization of the mechanisms required to execute the same plan repeatedly.
(3) Flow control is a control concept applied to workflows, to distinguish from static control of buffers of material or orders, to mean a more dynamic control of flow speed and flow volumes in motion and in process. Such orientation to dynamic aspects is the basic foundation to prepare for more advanced job shop controls, such as just-in-time or just-in-sequence.
(4) In-transit visibility is a monitoring concept that applies to transported material as well as to work in process or work in progress, i.e., workflows." [Workflow. Wikipedia]
The example "Workflow diagram - Business" was drawn using the ConceptDraw PRO diagramming and vector drawing software extended with the Workflow Diagrams solution from the Business Processes area of ConceptDraw Solution Park.
Business - Work flow chart

- Production Drawing Symbols Pdf Download
- Mechanical Production Engineering Drawing Symbol
- Download Symbols In Production Drawing
- Production Drawing Welding Symbol
- Symbol Drawing Used In Production Nd Plant
- Drawing Mech Symble Use For Production Pdf
- Symbol Of Production Drawing
- Mechanical Drawing Symbols | HVAC Plans | Data Flow Diagram ...
- Diagram Symbols For Mechanical Production
- Symbol Of Production Mechanical Engineering
- Production Quality Symbols Pdf
- Basic Drawing Symbols And Their Definition Mechanical
- Manufacturing Quality Symbols Pdf
- Manufacturing Machining Symbols Dreaing
- ConceptDraw Solution Park | Quality Symbols In Machine Drawing
- Process Flowchart | Mechanical Drawing Symbols | Manufacturing ...
- Process Flowchart | Cnc Machining Drawing Symbol Pdf File ...
- Mechanical Engineering | Mechanical Quality Engineering Symbol Pdf
- CNC Machine Drawing Symbols
- Mechanical Drawing Symbols | Electrical Symbols , Electrical ...