This site uses cookies. By continuing to browse the ConceptDraw site you are agreeing to our Use of Site Cookies.

How to Draw an Organization Chart

An Organizational chart is a type of diagram which visually displays the structure of an organization, relationships and relative ranks of the organization′s parts and positions. Organizational chart is constructed as an hierarchical structure, in the form of tree. How to Draw an Organization Chart the most easy and quickly? The Organizational Charts solution, innovative Tree Auto-connection mode and ConceptDraw Arrows10 Technology included in ConceptDraw DIAGRAM software are powerful drawing tools that change the way of diagrams production. Arrows10 Technology provides smart behavior for the connectors, and so quick and precise placement when drawing, and lets easy make the changes and automatic rearrangement. It helps to make the process of drawing diagrams more efficient, easier and faster. Now, you don′t need to think on how to connect or place the objects, you can concentrate fully on what to draw. See obligatory the helpful video tutorial about creation the Organization Charts and orgchart professional presentations with ConceptDraw products.

healthcare workflow diagram, healthcare workflow, healthcare workflow management, workflow analysis healthcare, clinical workflows in healthcare Healthcare Management Workflow Diagrams

healthcare workflow diagram, healthcare workflow, healthcare workflow management, workflow analysis healthcare, clinical workflows in healthcare
Healthcare Management Workflow Diagrams solution contains large set of colorful samples and libraries with predesigned vector pictograms and symbols of health, healthcare equipment, medical instruments, pharmaceutical tools, transport, medication, departments of healthcare organizations, the medical icons of people and human anatomy, as well as the predesigned flowchart objects, connectors and arrows, which make it the best for designing clear and comprehensive Medi?al Workflow Diagrams and Block Diagrams, Healthcare Management Flowcharts and Infographics, Healthcare Workflow Diagram, for depicting the healthcare workflow and clinical workflows in healthcare, for making the workflow analysis healthcare and healthcare workflow management.

How to Create Flowcharts for an Accounting Information System

Accounting information is a system of interrelated processes which represent financial and accounting data, required for decision making. For representing the accounting processes in a visual and easy for perception form are constructed Accounting Flowcharts. For their creation are used special flowchart symbols, this makes Accounting flowcharts understandable for all users of accounting information system and helps them easy understand the sequence of steps involved to accounting processes. But how to create Flowcharts for an Accounting Information System fast and easy? Use of special design software is useful for this. ConceptDraw DIAGRAM software extended with Accounting Flowcharts solution is the best for creation accurate Accounting Flowcharts, for documentation and visually communication on how accounting processes work, how each operation is done. Accounting Flowcharts solution is supplied with library of predesigned commonly used vector symbols, Accounting Flowchart templates and samples demonstrating receiving, purchasing, payment, and other accounting processes.

Flowchart on Bank. Flowchart Examples

This sample was created in ConceptDraw DIAGRAM diagramming and vector drawing software using the Flowcharts solution from the Diagrams area of ConceptDraw Solution Park. This sample shows the Flowchart of the Subprime Mortgage Crisis. This Flowchart describes the decline in housing prices when the housing bubble burst and what it caused on the housing and financial markets. You can also see the Government and Industry responses in this crisis situation.
Create Flowchart on Bank

Data Flow Diagram

Data Flow Diagram (DFD) is the part of the Structured Systems Analysis and Design Methodology (SSADM), which is intended for information systems projection and analysis. Data Flow Diagrams allow graphically represent the data flows in information system and analyze the data processing during the structural projection. This type of diagrams lets visually show a work of information system and results of this work, it is often used in connection with human processes and can be displayed as Workflow diagram. Data Flow Diagram visualizes processes and functions, external entities, data depositories, and data flows connecting these elements and indicating direction and data character. Each of these elements used for DFD has its own graphical notation. There are two notations to draw DFDs - Yourdon & Coad and Gane & Sarson. ConceptDraw DIAGRAM extended with Data Flow Diagrams (DFD) solution from Software Developmant area is ideal for designing professional looking DFDs, which can be then easily exported in various formats.

Work Order Process Flowchart. Business Process Mapping Examples

The business process is a set of actions or tasks which are undertaken by an organization for production some goods or services, they are then offered for the customers and are ordered by them. Process Flowcharts and Order Process Flowcharts are sufficiently prevalent, well known and actively used in variety of fields of life, business and science. They are constructed using the common standardized symbols, thus are clear and understandable for all. They help effectively represent the processes, determine the order in which the process activities happen, document the order processes, and also effectively analyze the processes with a goal to increase their efficiency. Create your own Process Flowcharts, Order Process Flowcharts, Cross-Functional Flow Charts representing the order processing steps using powerful drawing tools of ConceptDraw DIAGRAM software and variety of predesigned vector objects from the libraries of Business Process Mapping Solution from Business Processes area of ConceptDraw Solution Park.

Diagramming Software for Design UML Timing Diagrams

UML Timing Diagram as special form of a sequence diagram are used to explore the behaviors of objects throughout a given period of time.
HelpDesk

How to Create a Healthcare Management Workflow Diagram

The health and medical workflow diagrams are widespread in medicine to depict the sequence of actions of the medical workers to eliminate particular health problems of the patient. Also drawing is the best way to illustrate processes occurring in the human body. Healthcare Management Workflow Diagrams for ConceptDraw DIAGRAM provides the large set of colorful samples and libraries with predesigned vector pictograms and symbols of health, healthcare equipment, medical instruments, pharmaceutical tools, transport, medication, etc. The Healthcare Management Workflow Diagrams solution found in the Business Processes section of ConceptDraw Solution Park is the best choice for designing clear and comprehensive Medical Workflow Diagrams, Healthcare Management Flowcharts and Infographics.

Create Organizational Chart

ConceptDraw DIAGRAM software is greatly powerful in many fields due to the large collection of provided solutions by ConceptDraw Solution Park, among them the cost effective Organizational Chart design capabilities. Organizational Charts Solution from the Management Area of ConceptDraw Solution Park perfectly suits for analyzing the organizational structures, visualizing and designing Organizational Charts for the companies of any sizes, for creation the hotel organizational chart, hospital organizational chart, corporate organizational chart, different flow charts, time lines, and much more. Organizational Charts Solution makes ConceptDraw DIAGRAM the perfect analyzer tool for managers and administrative staff. It offers plenty of useful and convenient tools for ConceptDraw DIAGRAM users, including the set of Organizational chart templates that make the process of creation Organizational Charts on their base easier and quicker, extensive Organizational chart library of tasks-specific symbols and shapes, helpful Organizational chart examples and samples.

Business Process Mapping — How to Map a Work Process

ConceptDraw DIAGRAM is a world-class diagramming platform that lets you display, communicate, and present dynamically. It′s powerful enough to draw everything from basic flowcharts to complex engineering schematics. Video tutorials on ConceptDraw products. Try it today!

business process flow diagrams, business process diagram example, business process diagram, process diagrams Business Process Diagrams

business process flow diagrams, business process diagram example, business process diagram, process diagrams
Business Process Flow Diagrams solution extends the ConceptDraw DIAGRAM BPM software with RapidDraw interface, templates, business process diagrams examples and numerous libraries based on the BPMN 1.2 and BPMN 2.0 standards, which give you the possibility to visualize equally easy simple and complex processes, to design business models, to quickly develop and document in details any business processes on the stages of project’s planning and implementation.

Examples of Flowcharts, Org Charts and More

ConceptDraw DIAGRAM covers a broad spectrum of business graphics categories and offers at ConceptDraw STORE enormous online collection of pictorial examples and samples for different thematics and application areas. It is a plentiful source of inspiration and wonderful examples of professionally designed diagrams, flowcharts, UML diagrams, organizational charts, databases, ERDs, network diagrams, business charts, different thematic charts, schematics, infographics and plans developed specially for knowledge workers, engineers, managers, businessmen, marketing specialists, analytics, scientists, students, professors, journalists and also for a large number of other people that every day use various diagrams and drawings in their work and life activity. Each of these examples is a real art, all they are well thought-out and designed without efforts with help of powerful tools of ConceptDraw DIAGRAM software. ConceptDraw examples display all variety of tasks, possibilities and results that ConceptDraw Product Line lets achieve fast and easy. ConceptDraw is one of the best Visio alternatives for Mac. It open all Visio formats like.vsdx,.vss,.vdx files and allows you to export files to Visio formats.
What is ConceptDraw OFFICE

Organizational Chart

An organizational chart is a diagram that shows the structure of an organization and the relationships of its parts. ConceptDraw DIAGRAM extended with Organizational Charts Solution from the Management Area is powerful Organizational Chart Software.

How To Create Emergency Plans and Fire Evacuation

Fire emergency and Fire escape plans are used in hospitals, schools, kindergartens, universities, hotels, offices, business and shopping centers, homes, etc. They are obligatory according to the safety standards and instructions and effectively help people in cases of fires, natural disasters, hazardous leaks and other disaster events that can happen. How to create Emergency Plan or Fire Evacuation Plan fast and easy? The ConceptDraw DIAGRAM diagramming and vector drawing software recommends to use the specially developed Fire and Emergency Plans solution from the Building Plans area of ConceptDraw Solution Park, which is equipped with powerful drawing tools, collection of predesigned templates and samples of Emergency Plans, and also large set of specific vector design elements. Use them to design Evacuation plans, Emergency plans, Fire evacuation plans, Fire emergency plans, Fire safety diagrams, Home emergency plans, Office emergency plans, Business emergency plans and many other kinds of diagrams in minutes.

Data Flow Diagram (DFD)

A Data Flow Diagram (DFD) illustrates the flow of data through an information system, visualizes how the information is handled in terms of inputs and outputs, how the data enter to system and leave it. It is effective to use a Data Flow Diagram for creation the system's overview, to show the system's scope and boundaries. There are two different types of notations for DFDs: Yourdon-Coad and Gane-Sarson, which differ in visual representations for processes, data flow, data stores, external entities, etc. Thus, for example the processes are depicted as circles in Yourdon-Coad notation and as rounded squares in Gane-Sarson notation. Gane-Sarson notation is usually used for visualization information systems and Yourdon-Coad - for system analysis and design. The Data Flow Diagrams solution included to Software Development area of ConceptDraw Solution Park offers a lot of DFD templates, samples and examples, libraries of vector stencils for construction without efforts the DFDs according to both Gane-Sarson and Yourdon-Coad notations.

Organization Chart Software

Create Organizational Chart Software - You need create Organizational Chart? Nothing could be easier with ConceptDraw DIAGRAM diagramming and vector drawing software. ConceptDraw DIAGRAM presents the Organizational Charts Solution from the Management Area that will allow you to draw the Organization Charts of any difficulty easy and quick.
How to draw an Organizational Chart

Emergency Plan

The Fire Emergency Plan illustrates the scheme of the building and location of the main and fire exits for a safe evacuation, and clearly defines directions to them on the plan. Fire Emergency Plans are constructed on the case of unexpected or emergency situations, fires, hazardous leaks, natural disasters, and other sudden events. They must to be obligatorily on the plain sight at every building and on each floor, at living houses and apartments, schools and universities, medical centers, clinics and hospitals, office buildings, banks, cafes, restaurants, and also at all other public buildings and institutions. The Evacuation plans and Emergency Plans preliminary designed in ConceptDraw DIAGRAM software help employees and family members when some emergency events happen and let avoid the accidents and sad consequences, prevent injuries and fatalities, allow reduce damages and speed the work resumption. Start drawing emergency blueprint from floor bounds, then add the inner walls and doors, and finally use bright arrows to visually show evacuation directions to fire exits. ConceptDraw is a serious alternative to Visio. It's a desktop based solution aimed at professional designers working in CAD environments. It is also a good option for those who work between Mac and PC because one license is valid for both.
How to Draw a Floor Plan

Taxi Service Data Flow Diagram DFD Example

This sample shows the Data Flow Diagram of the Taxi Service and interactions between the Clients, Operators and Divers, as well as Orders and Reports databases.
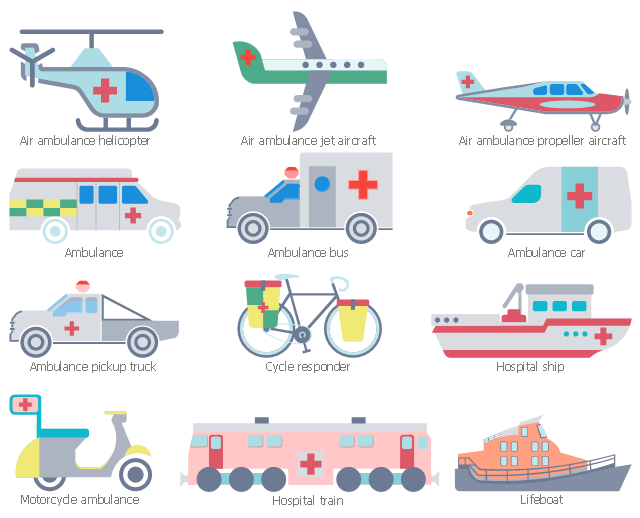
The vector stencils library "Healthcare transport" contains 12 medical vehicle icons.
Use it to design your healthcare workflow diagrams, flowcharts and infographics with ConceptDraw PRO software.
"An emergency vehicle is any vehicle that is designated and authorized to respond to an emergency in a life-threatening situation. These vehicles are usually operated by designated agencies, often part of the government, but also run by charities, non-governmental organizations and some commercial companies. ...
There are many types of emergency vehicle, dependent on jurisdiction. Some examples of emergency vehicles include: ...
Medical:
* Motorcycle ambulance,
* Rapid response vehicle (car),
* Ambulance,
* Air ambulance,
* Organ transplant or blood supply vehicles." [Emergency vehicle. Wikipedia]
The medical vehicle icon set example "Design elements - Healthcare transport" is included in Healthcare Workflow Diagrams solution from Business Processes area of ConceptDraw Solution Park.
Workflow shapes
Workflow shapes, motorcycle ambulance, lifeboat, hospital train, hospital ship, drawing shapes, cycle responder, ambulance pickup truck, ambulance car, ambulance bus, ambulance, air ambulance propeller aircraft, air ambulance jet aircraft, air ambulance helicopter,
HelpDesk

How to Create a Health Informatics Diagram

The ability to create Health Informatics Workflow diagrams is provided with the ConceptDraw Health Informatics solution. It includes 33 vector graphics icons and 10 sample documents that can be used when representing the flow of data, documents, and tasks during the performance of a health management process.