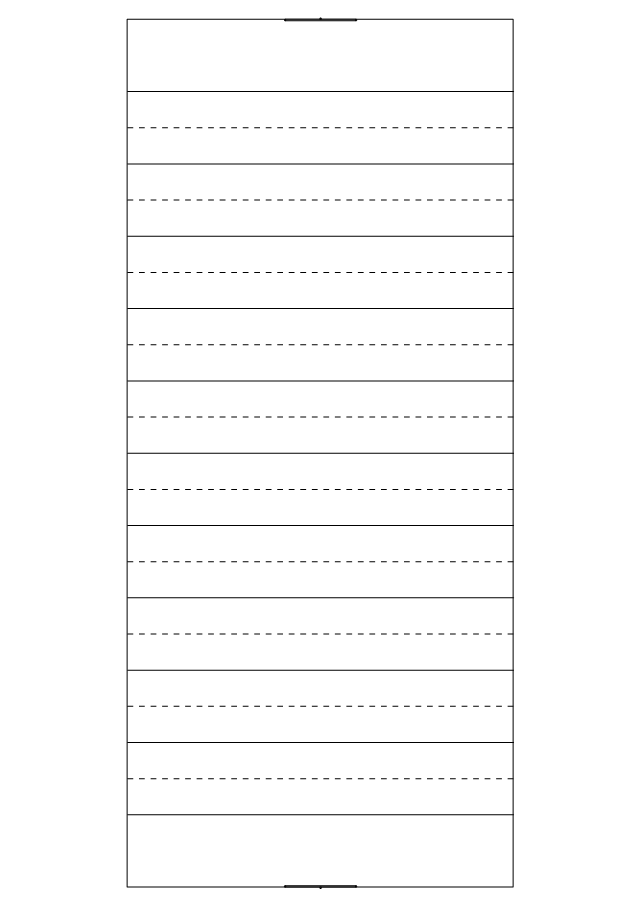
Ice Hockey Rink Diagram

"An ice hockey rink is an ice rink that is specifically designed for ice hockey, a team sport. It is rectangular with rounded corners and surrounded by a wall approximately 1 meter (40-48 inches) high called the boards. ...
There are two standard sizes for hockey rinks: one used primarily in North America, the other used in the rest of the world.
International.
Hockey rinks in most of the world follow the International Ice Hockey Federation (IIHF) specifications, which is 61 metres (200 ft) × 30.5 metres (100 ft) with a corner radius of 8.5 metres (28 ft). The distance from the end boards to the nearest goal line is 4 metres (13 ft). The distance from each goal line to the nearest blue line is 17.3 metres (57 ft). The distance between the two blue lines is also 17.3 metres (57 ft).
North American.
Most North American rinks follow the National Hockey League (NHL) specifications of 200 feet (61 m) × 85 feet (26 m) with a corner radius of 28 feet (8.5 m). The distance from the end boards to the nearest goal line is 11 feet (3.4 m). The NHL attacking zones are expanded, with blue lines 64 feet (20 m) from the goal line and 50 feet (15 m) apart." [Ice hockey rink. Wikipedia]
The diagram template "Hockey rink" for the ConceptDraw PRO diagramming and vector drawing software is included in the Hockey solution from the Sport area of ConceptDraw Solution Park.
Ice hockey rink diagram template

Defensive Strategy Diagram – 46 Defence

Basketball Plays Software
Basketball Court Dimensions

Baseball Diagram – Basic Bunt Coverage – Runner at 2nd

Baseball Diagram — Baseball Field — Corner View — Sample

Baseball Diagram – Colored Baseball Field

 Network Layout Floor Plans
Network Layout Floor Plans solution extends ConceptDraw DIAGRAM software functionality with powerful tools for quick and efficient documentation the network equipment and displaying its location on the professionally designed Network Layout Floor Plans. Never before creation of Network Layout Floor Plans, Network Communication Plans, Network Topologies Plans and Network Topology Maps was not so easy, convenient and fast as with predesigned templates, samples, examples and comprehensive set of vector design elements included to the Network Layout Floor Plans solution. All listed types of plans will be a good support for the future correct cabling and installation of network equipment.
 Computer Network Diagrams
Computer Network Diagrams solution extends ConceptDraw DIAGRAM software with samples, templates and libraries of vector icons and objects of computer network devices and network components to help you create professional-looking Computer Network Diagrams, to plan simple home networks and complex computer network configurations for large buildings, to represent their schemes in a comprehensible graphical view, to document computer networks configurations, to depict the interactions between network's components, the used protocols and topologies, to represent physical and logical network structures, to compare visually different topologies and to depict their combinations, to represent in details the network structure with help of schemes, to study and analyze the network configurations, to communicate effectively to engineers, stakeholders and end-users, to track network working and troubleshoot, if necessary.
Computer Network Diagrams
Computer Network Diagrams solution extends ConceptDraw DIAGRAM software with samples, templates and libraries of vector icons and objects of computer network devices and network components to help you create professional-looking Computer Network Diagrams, to plan simple home networks and complex computer network configurations for large buildings, to represent their schemes in a comprehensible graphical view, to document computer networks configurations, to depict the interactions between network's components, the used protocols and topologies, to represent physical and logical network structures, to compare visually different topologies and to depict their combinations, to represent in details the network structure with help of schemes, to study and analyze the network configurations, to communicate effectively to engineers, stakeholders and end-users, to track network working and troubleshoot, if necessary.
 Entity-Relationship Diagram (ERD)
An Entity-Relationship Diagram (ERD) is a visual presentation of entities and relationships. That type of diagrams is often used in the semi-structured or unstructured data in databases and information systems. At first glance ERD is similar to a flowch
 Baseball
The Baseball Solution extends ConceptDraw DIAGRAM.5 (or later) software with samples, templates, and libraries of vector objects for drawing baseball diagrams, plays, and illustrations. It can be used to make professional looking documents, presentations,
 Computer and Networks Area
The solutions from Computer and Networks Area of ConceptDraw Solution Park collect samples, templates and vector stencils libraries for drawing computer and network diagrams, schemes and technical drawings.
 Concept Maps
The technique of concept mapping was developed as a constructive way of representing knowledge in science and increasing the meaningfulness of learning. Now, the creation of a concept map is extremely helpful when used in education as learning and teaching techniques that assist memorization. Concept maps are also used for idea generation in brainstorming sessions, and for detailing the structure of complex ideas.
 GHS Hazard Pictograms
GHS Hazard Pictograms solution contains the set of predesigned standard GHS pictograms, Hazardous symbols, and Hazard communication pictograms, approved and agreed by UN in Globally Harmonized System of Classification and Labelling of Chemicals (GHS). They can be used for quick and simple designing accurate and professional-looking infographics, diagrams, warning announcements, signboards, posters, precautionary declarations, regulatory documents, and for representing the main items of OSHA HAZCOM Standard.
"Baseball is played between two teams with nine players in the field on each team. On a baseball field, the game is under authority of several umpires. There are usually four umpires in major league games; up to six (and as few as one) may officiate depending on the league and the importance of the game. There are four bases. Numbered counterclockwise, first, second and third bases are cushions (sometimes informally referred to as bags) shaped as 15 in (38 cm) squares which are raised a short distance above the ground; together with home plate, the fourth "base," they form a square with sides of 90 ft (27.4 m) called the diamond. Home base (usually called home plate) is a pentagonal rubber slab 17 in (43.2 cm) wide. The playing field is divided into three main sections:
(1) The infield, containing the four bases, is for general defensive purposes bounded by the foul lines and within the grass line (see figure).
(2) The outfield is the grassed area beyond the infield grass line between the foul lines, and bounded by a wall or fence.
(3) Foul territory is the entire area outside the foul lines.
The pitcher's mound is located in the center of the infield. It is an 18 ft (5.5 m) diameter mound of dirt no higher than 10 in (25.4 cm). Near the center of the mound is the pitching rubber, a rubber slab positioned 60 ft 6 in (18.4 m) from home plate. The pitcher must have one foot on the rubber at the start of every pitch to a batter, but the pitcher may leave the mound area once the ball is released." [Baseball rules. Wikipedia]
The baseball positions diagram example "Corner view baseball field" was created using the ConceptDraw PRO diagramming and vector drawing software extended with the Baseball solution from the Sport area of ConceptDraw Solution Park.
Baseball positions diagram

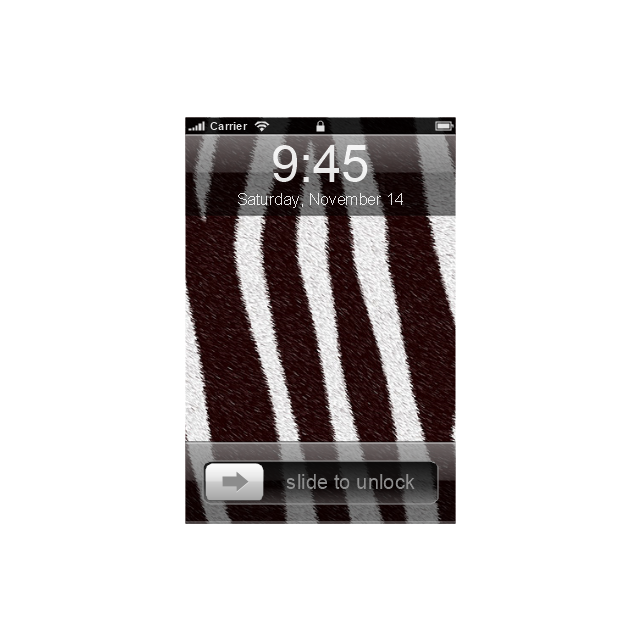
The vector stencils library "iPhone interface" contains 119 iPhone UI design elements.
Use it for development of graphic user interface (GUI) for iPhone software applications in the ConceptDraw PRO diagramming and vector drawing software extended with the Graphic User Interface solution from the Software Development area of ConceptDraw Solution Park.
Use it for development of graphic user interface (GUI) for iPhone software applications in the ConceptDraw PRO diagramming and vector drawing software extended with the Graphic User Interface solution from the Software Development area of ConceptDraw Solution Park.
iPhone case

iPhone case, horizontal

Display
Screen

Home screen

Keypad control

Status bar
Navigation bar

Navigation bar with buttons

Navigation bar with controls
Navigation bar with controls

Navigation bar with buttons, horizontal

Navigation bar with controls, horizontal
Modal view

Search bar

Text field 1

Text field 2

Text field, varying

Table row

Table view row

Table view (simple list)
-iphone-interface---vector-stencils-library.png--diagram-flowchart-example.png)
Table view (with header)
-iphone-interface---vector-stencils-library.png--diagram-flowchart-example.png)
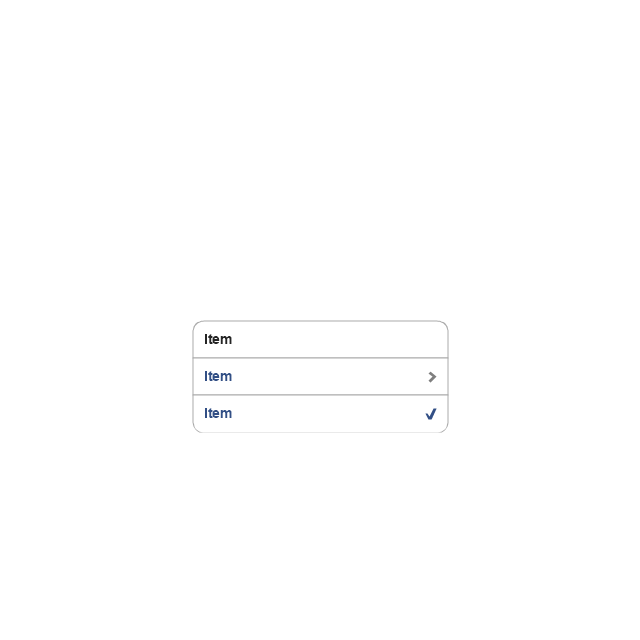
Action list
Control button

Navigational control button

Add button

Navigation toolbar

Tab bar

Action sheet

Choice button

Rounded rectangle button

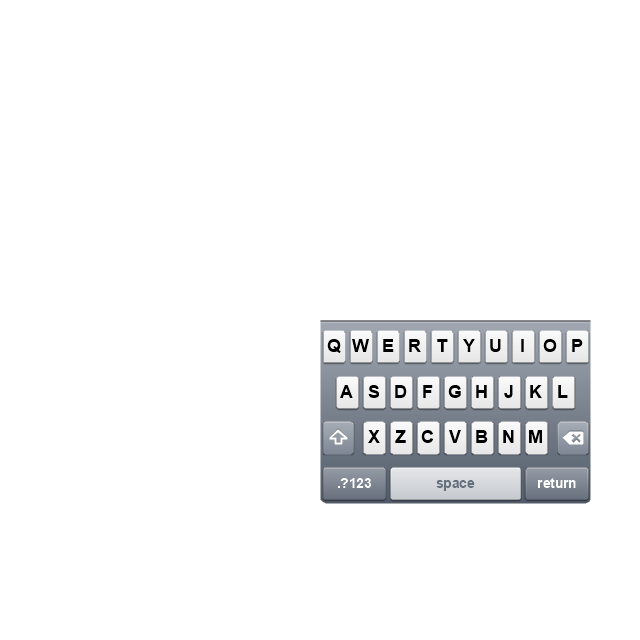
Keyboard control
Keyboard literal button
Keyboard button, pressed
Keyboard label button

Selection frame 1

Selection frame 2

Loupe

Message box 1
Message box 2

Progress view

Progress view

Progress view

Player control

Label button

Back button

Forward button

Option button
Checkbox

Radio button

Alert

Two-button alert
Two-button alert (v 3.0)
-iphone-interface---vector-stencils-library.png--diagram-flowchart-example.png)
Up-Down control

Segmented control

Segmented control

Segmented control
Segmented control
Pop-up menu button

Popup menu

Clock, white

Clock, black

Clock application table

Date and time picker (1/2 parts)
-iphone-interface---vector-stencils-library.png--diagram-flowchart-example.png)
Date and time picker (3 parts)
-iphone-interface---vector-stencils-library.png--diagram-flowchart-example.png)
Date and time picker (4 parts)
-iphone-interface---vector-stencils-library.png--diagram-flowchart-example.png)
Date and time picker (v 3.0)
-iphone-interface---vector-stencils-library.png--diagram-flowchart-example.png)
Switch control

System button

Reply button

Organize button

Remove button

Refresh button

Play button

FastForward button

Pause button

Rewind button

Backward icon
Forward icon
Share button

Camera button

Compose button

Bookmarks button

Search button

Add button

Trash button

Bookmarks tab icon
Contacts tab icon
Downloads tab icon
Favorites tab icon
Featured tab icon
History tab icon
MostRecent tab icon
MostViewed tab icon
Search tab icon
More tab icon
SMS tab icon
Mail tab icon
Charts tab icon
World clock tab icon
Alarm tab icon
Stopwatch tab icon
Timer tab icon
Badge
Delete button control

Checkmark

Delete button

Insert

Disclosure indicator

Clear button

Bookmarks badge
Badge with varying width 1
Badge with varying width 2
Badge with varying width 3
Activity indicator

Network activity indicator

Page control

Search badge
Slider

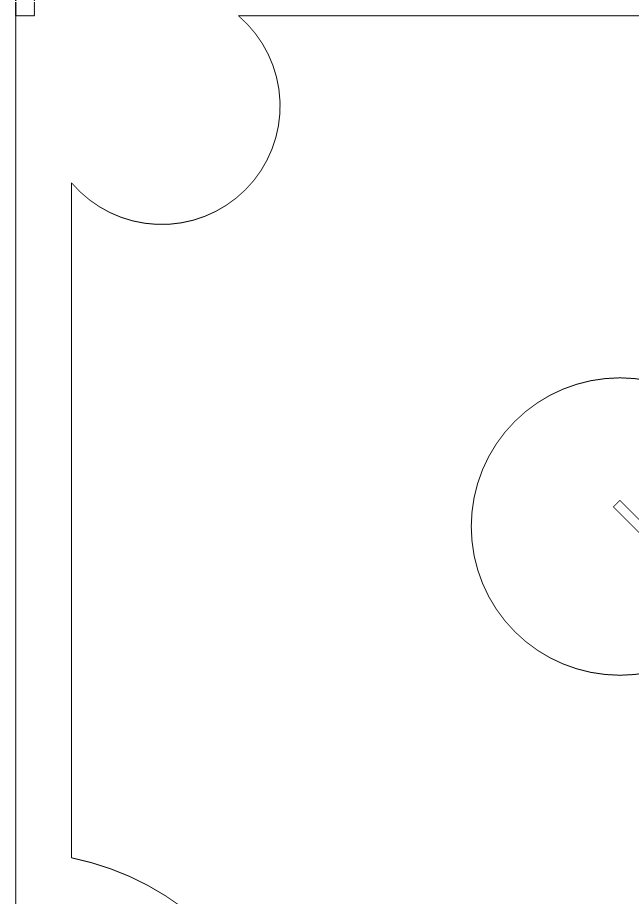
The vector stencils library "Sport fields and recreation" contains 25 shapes of sport fields and recreation design elements. Use it for drawing sport fields and recreation area plans with the ConceptDraw PRO diagramming and vector drawing software.
The vector stencils library "Sport fields and recreation" is included in the Sport Field Plans solution from the Building Plans area of ConceptDraw Solution Park.
The vector stencils library "Sport fields and recreation" is included in the Sport Field Plans solution from the Building Plans area of ConceptDraw Solution Park.
Rectangular pool

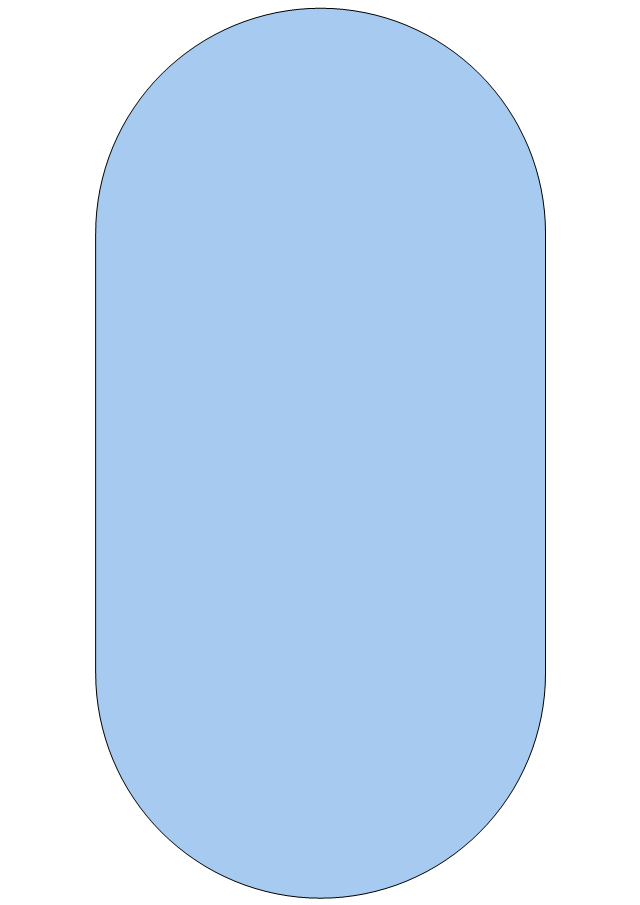
Oval pool
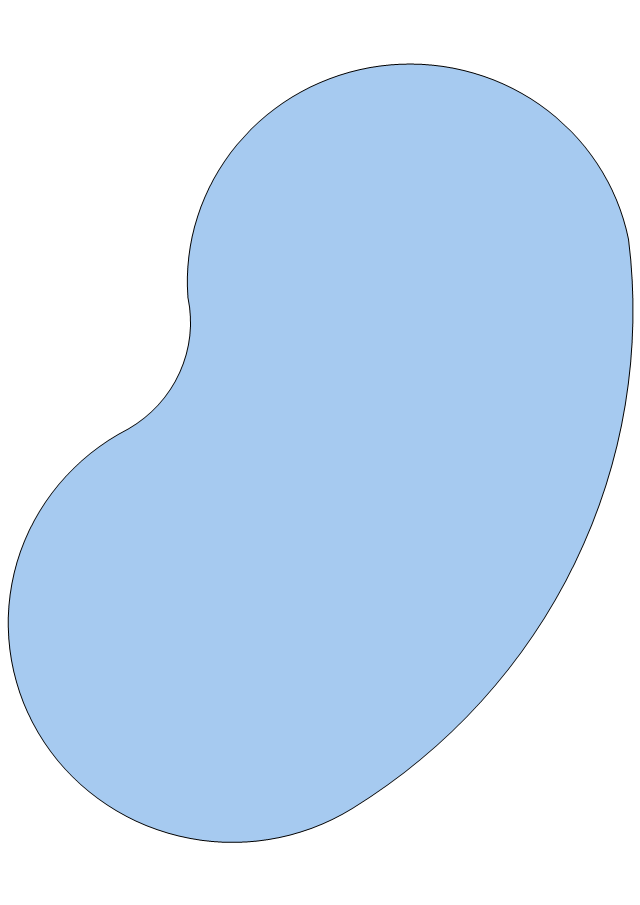
Kidney-shaped pool
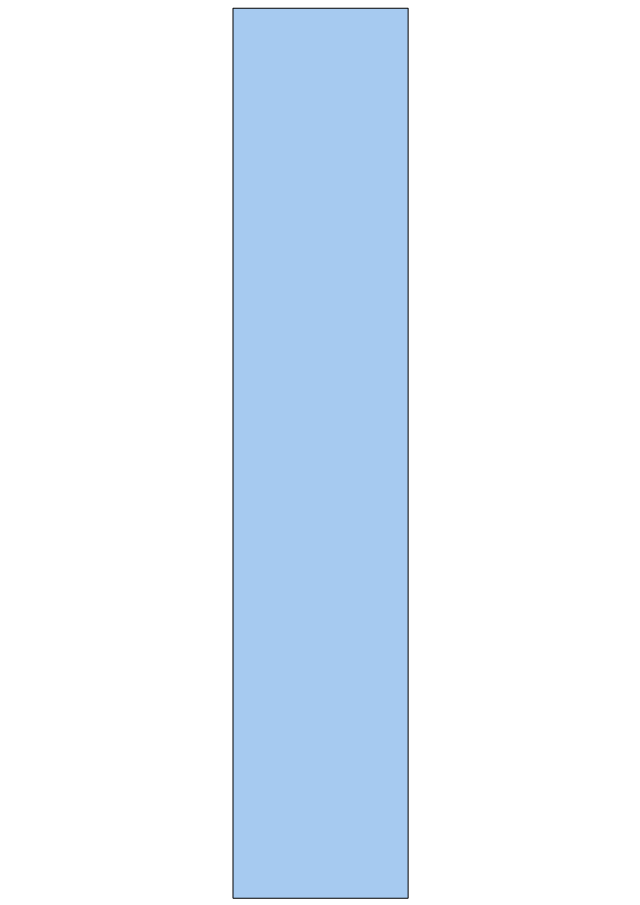
Lap pool
Competition pool
Spa
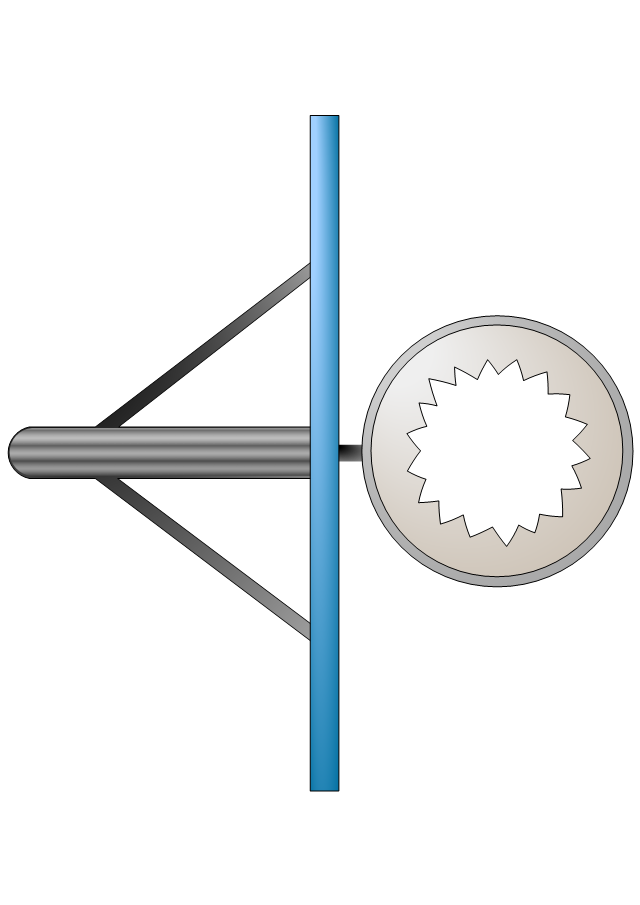
Diving board
Swing set
Play structure
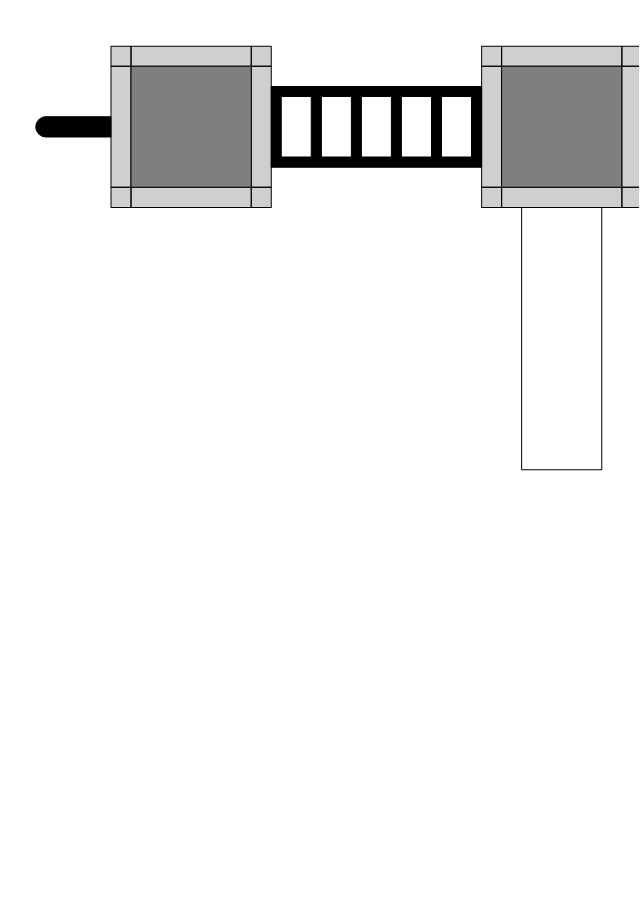
Basketball hoop
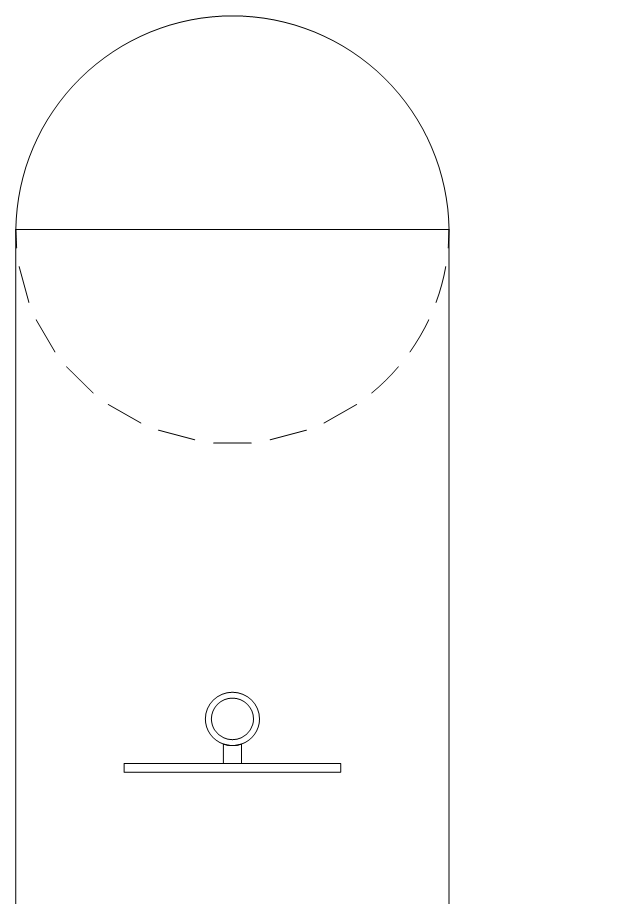
Basketball key
Basketball 3-pt.

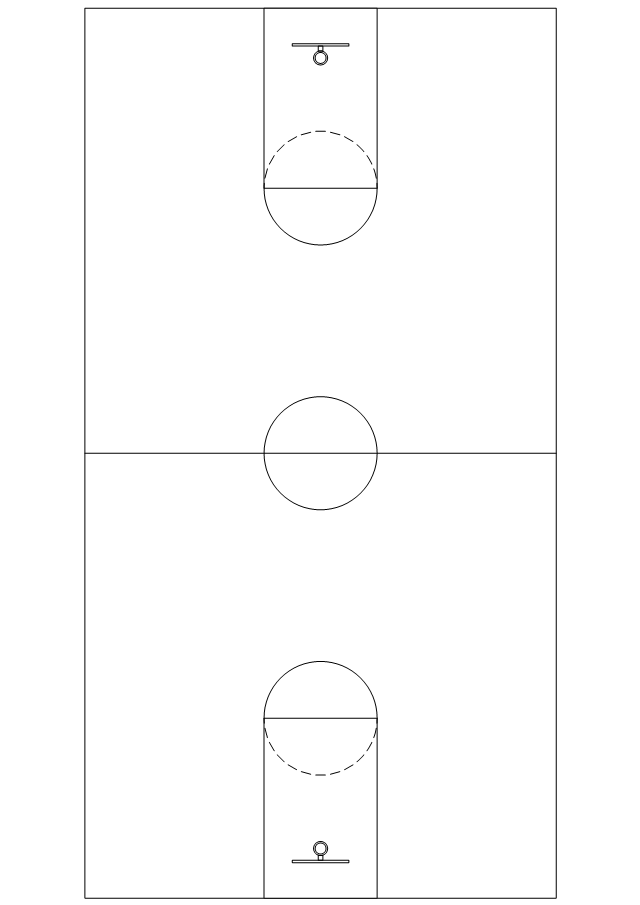
Basketball court
Badminton court
Volleyball court
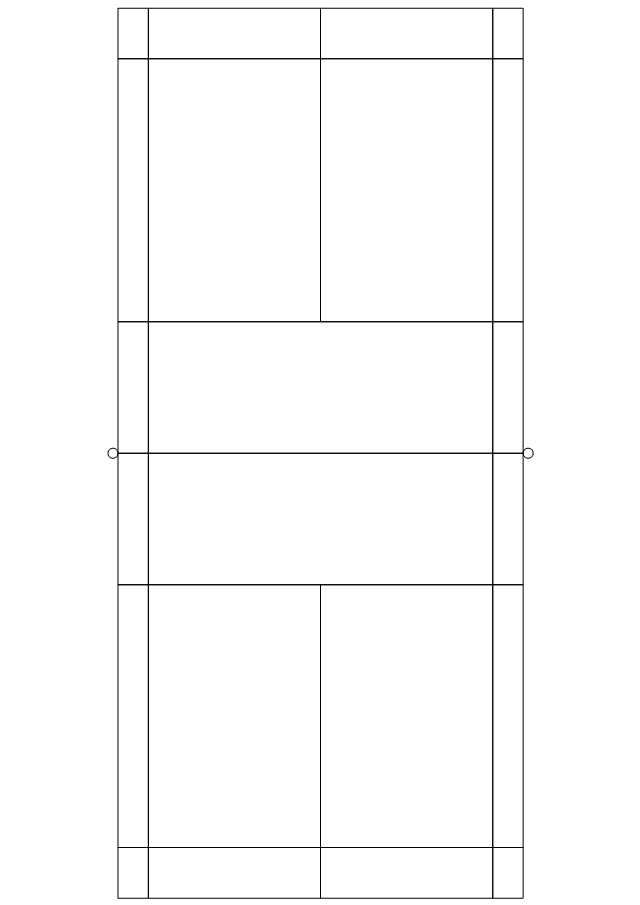
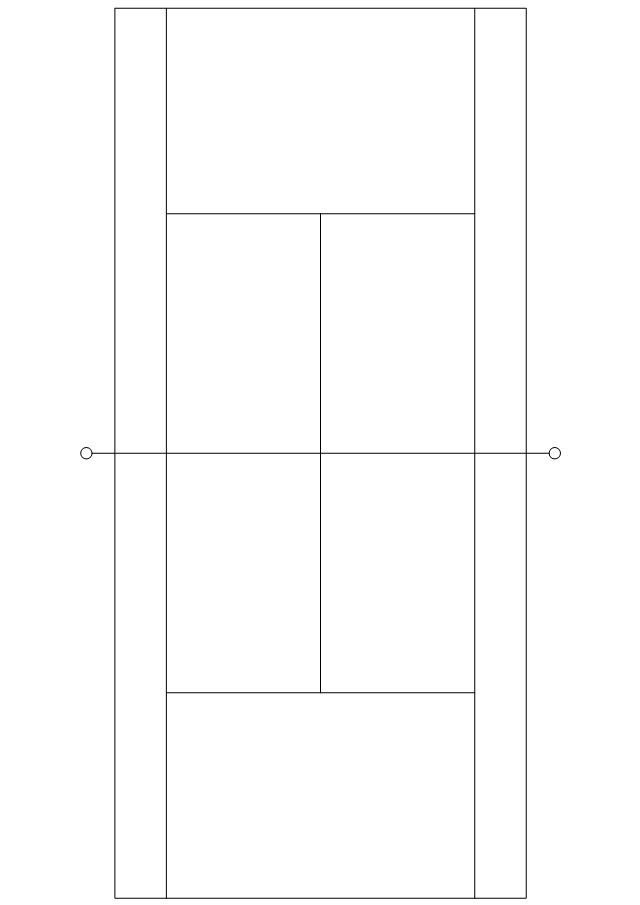
Tennis court
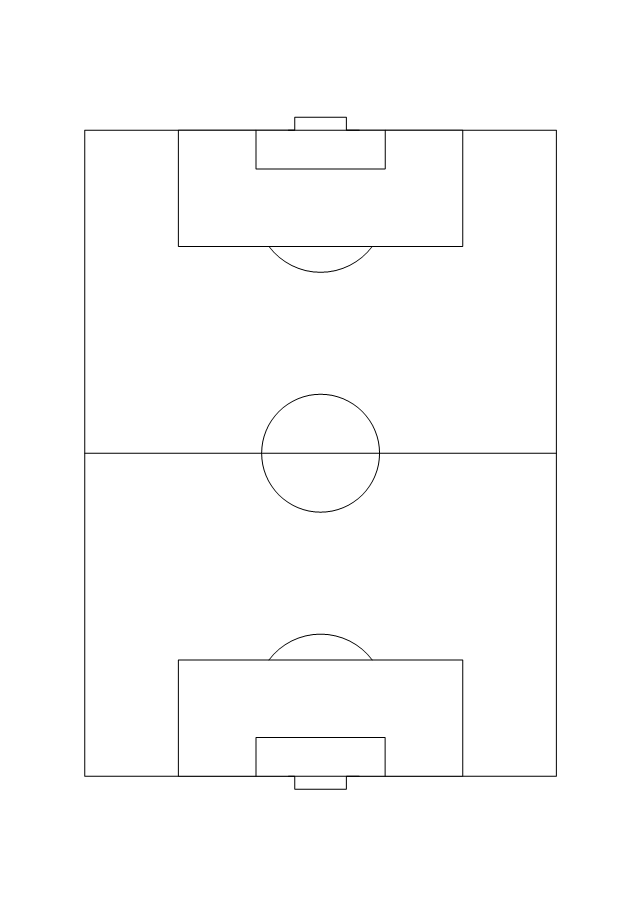
Soccer field
Football field
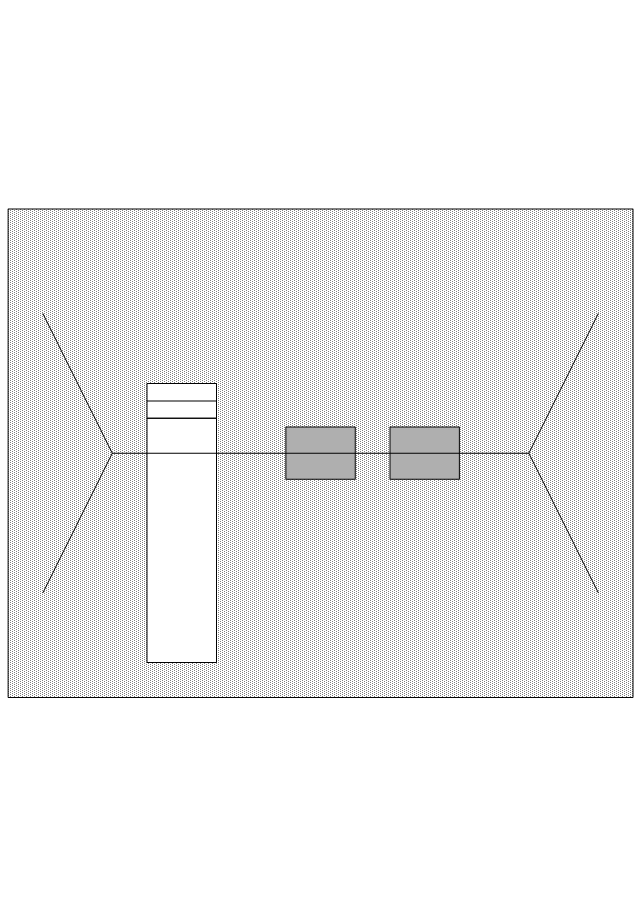
Baseball diamonds
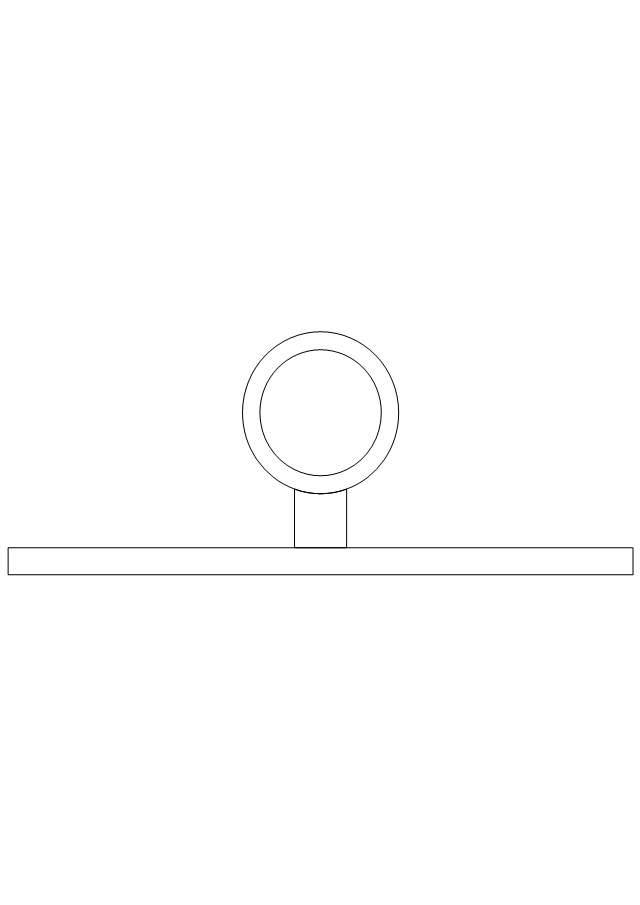
Basketball ring
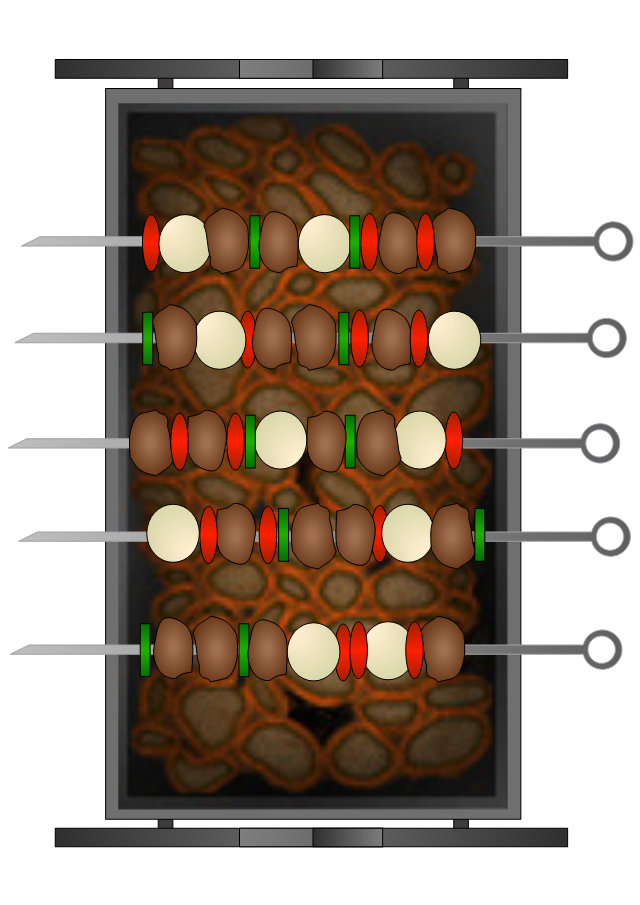
Barbecue
Swing 1
Swing 2
Sand-box 1

Sand-box 2
 Transport Hazard Pictograms
Transport Hazard Pictograms solution includes large variety of specially developed samples with transport hazard symbols and pictograms, and the whole set of predesigned vector transport GHS pictograms download and used with ease from the Transport Hazard Pictograms library. Apply them for quick designing professional-looking infographics and diagrams, use them to create warning signboards and announcements on all stages of the transportation process, to place them on the transport vehicles and warehouses of transportation companies, at the transport documentation and on the websites of transport and logistics companies.
- Diagram Of A Hockey Pitch And Labelled
- Draw And Label A Standard Hockey Field
- Diagram Of Hockey Field And Label
- Draw And Label A Hockey Pitch
- Diagram Of Hockey Pitch And Stick With Labelling
- Basketball Court Diagram and Basketball Positions | Soccer ...
- Well Labelled Hockey Field
- Draw A Well Labelled Football Field
- Hockey Pitch And Its Labelling
- Draw A Hockey Pitch And Label
- A Well Labelled Diagram Pf A Hockey Stick
- Draw And Label A Well Standard Hockey Pitch
- Ice Hockey Rink Diagram
- Ice Hockey Rink Dimensions | Ice Hockey Diagram – Deke ...
- Ice Hockey Rink Diagram
- Ice Hockey Rink Dimensions | Soccer (Football) Tactics | Basketball ...
- Ice Hockey Rink Dimensions | Soccer (Football) Formation | Ice ...
- Drawing And Labelling Of Hockey Sticks
- Label Diagram Of A Hockey Pitch
- Well Labeled Diagram Of A Hockey Pitch