Ice Hockey Rink Dimensions
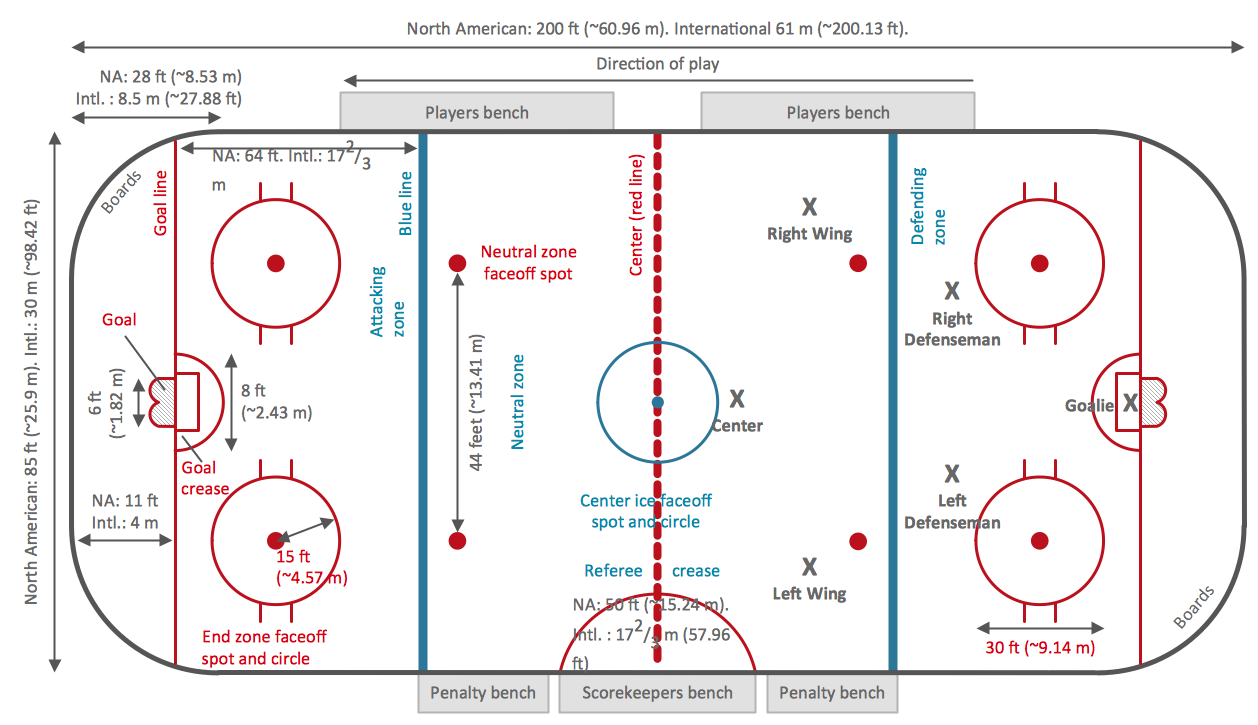
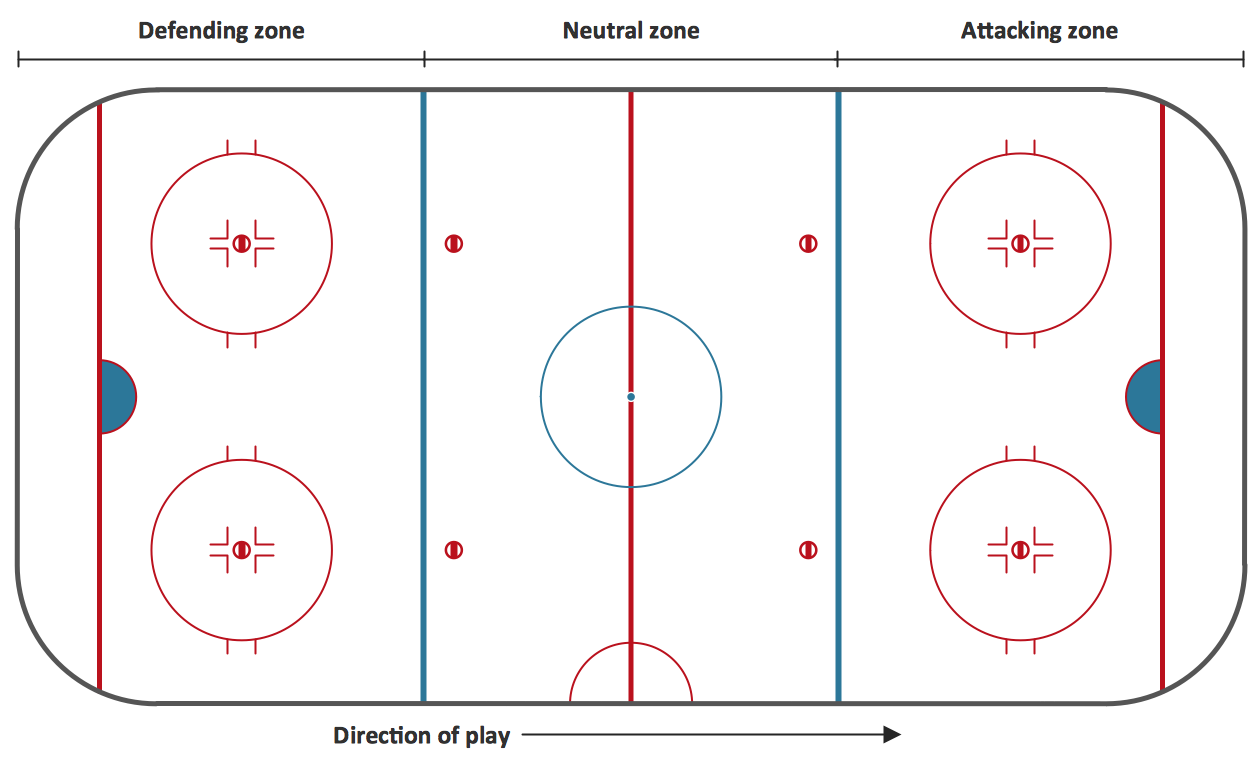
Meeting ice hockey rules one should learn ice hockey rink terms, lines, zones etc. ConceptDraw PRO is an advanced drawing software that allows you produce ice hockey rink depiction of any complexity, from simple sketch drawing to detailed one as on example below.Ice Hockey Rink Diagram
The main advantage of using ConceptDraw Ice Hockey Solution is that you don't need to draw objects manually, you have all you need in libraries, templates and samples. This allows you produce professional ice hockey diagrams as quickly as possible, and then post them to blog or social media, print or present on a large screen.Soccer (Football) Positions
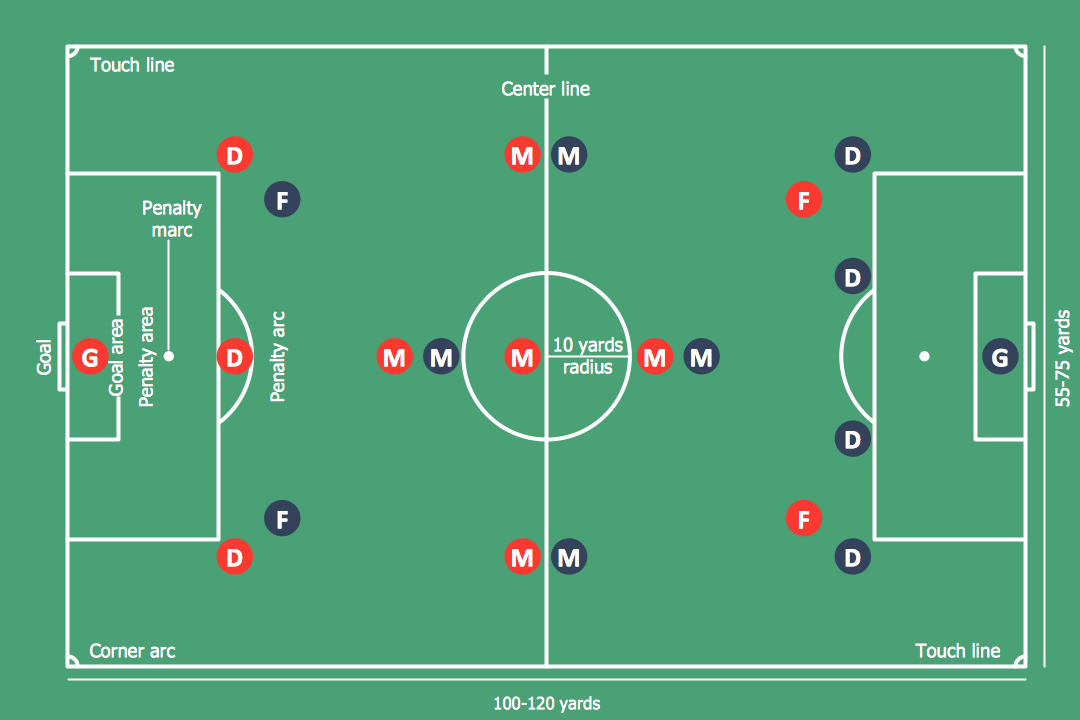
Explaining soccer positions becomes much more easier and time saving with visual drawings. ConceptDraw PRO software extended with the Soccer solution from the Sport area of ConceptDraw Solution Park is very useful tool that will help you design the soccer-related drawings of any complexity in minutes.Soccer (Football) Formation
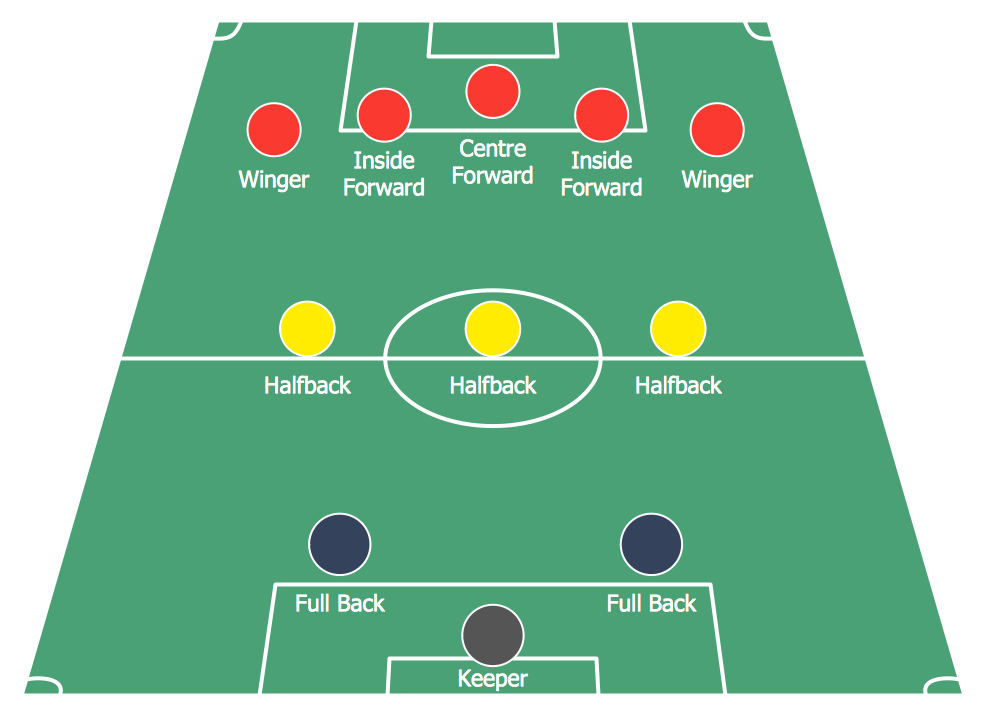
Using diagrams is the easiest way to explain the soccer formations. The Soccer solution from the Sport area of ConceptDraw Solution Park is designed as a tool that helps you produce the soccer diagrams in a few minutes. The predesigned samples of the Soccer solution for ConceptDraw PRO depict the most popular formation diagrams.Basketball Court Diagram and Basketball Positions
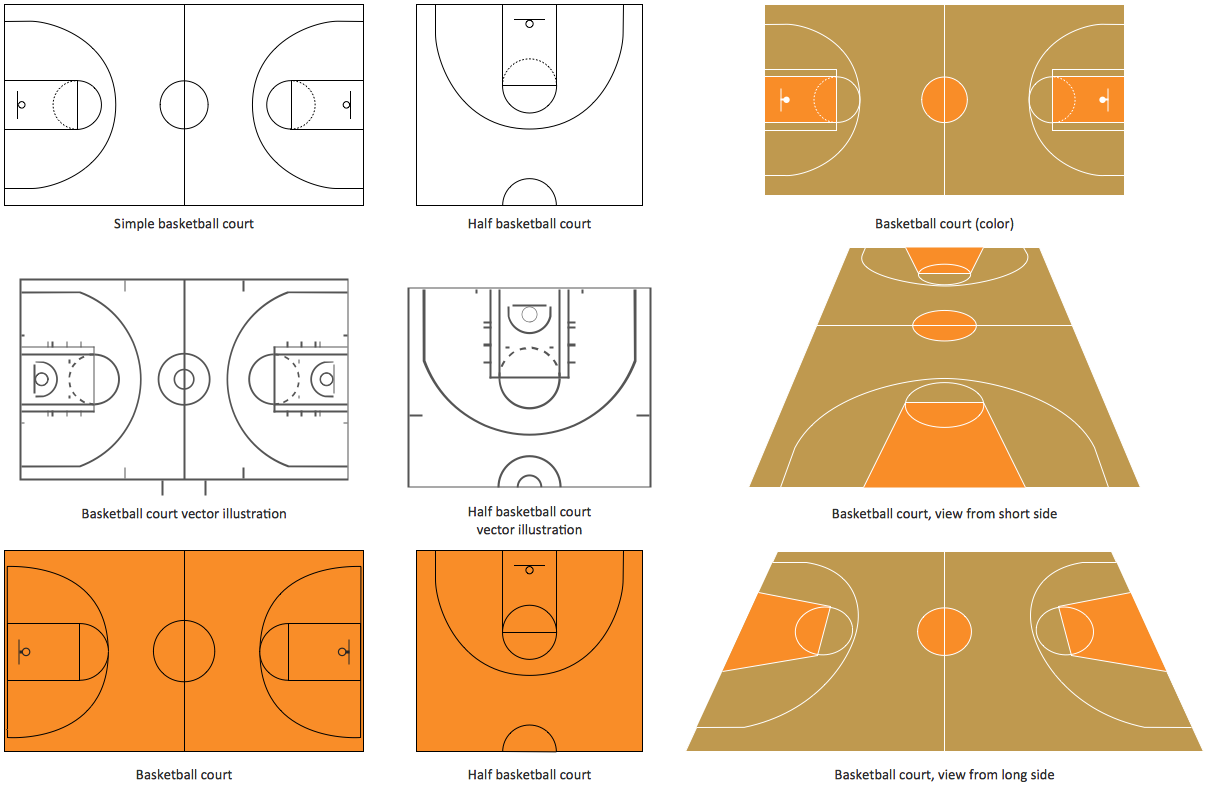
The illustration of possible situations during the basketball matches, presentation of basketball positions and the best tactics, explanation of rules and training to successful game, become much more easier and time saving with visual illustrations and drawings. Creation of several illustrations and comparing them lets effectively show the differences and advantages in positions of players. ConceptDraw PRO software extended with Basketball solution from Sport area of ConceptDraw Solution Park provides the shapes' libraries with different kinds of basketball courts and basketball positions, templates and samples, which will render great help for basketball specialists and fans in drawing professional-looking and illustrative basketball-related diagrams and schematics of any complexity in a few minutes. Extensive export capabilities of ConceptDraw PRO to varied graphical formats open before you wide field for activities and possibility to easy communicate with large quantity of people, which have different software installed on their devices.Baseball Diagram – Basic Bunt Coverage – Runner at 1st
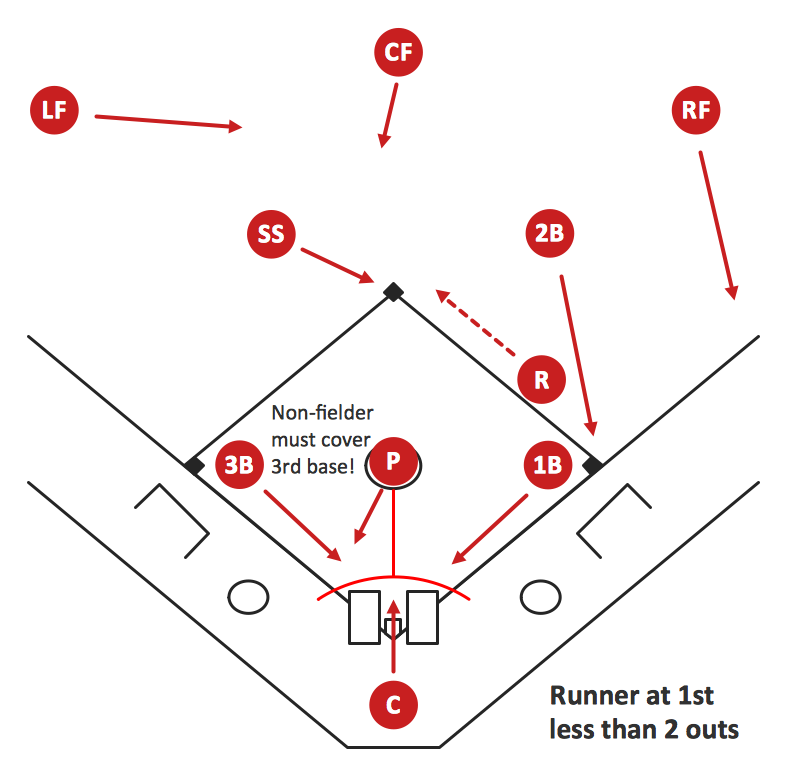
ConceptDraw PRO software extended with the Baseball solution delivers samples with diagrams of the most popular plays in baseball. You can complete this set modifying any sample. All you need is to drag and drop objects to depict another play and then save with the different name. Feel free to add text label with the play name directly to your document.Soccer (Football) Diagram Software
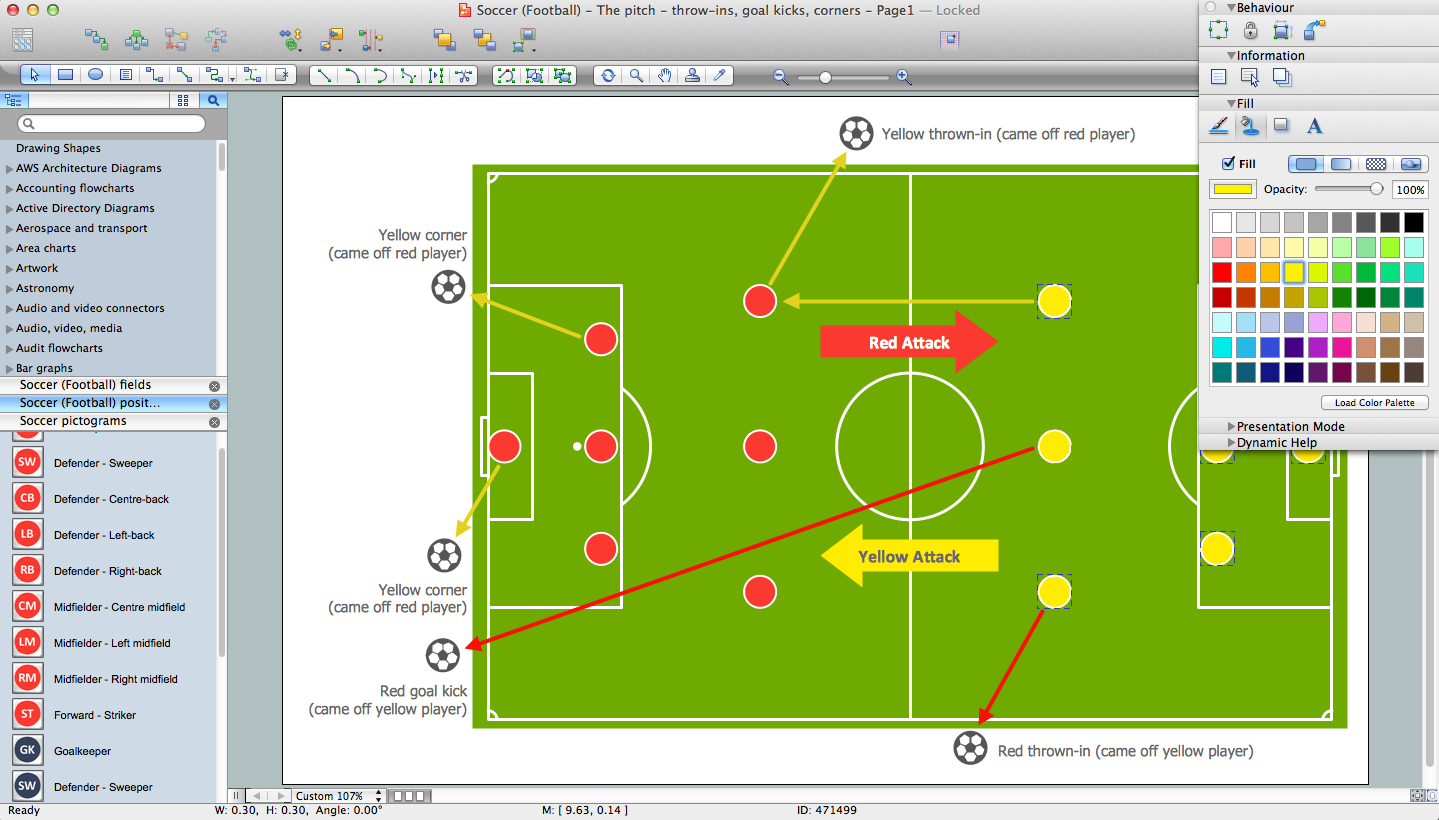
Explaining the soccer strategies and techniques is practically impossible without drawing a diagram. ConceptDraw PRO diagramming and vector drawing software extended with Soccer solution from the Sport area of ConceptDraw Solution Park is a very convenient and useful tool for designing the soccer-related diagrams.Baseball Diagram – Defensive Fly Ball
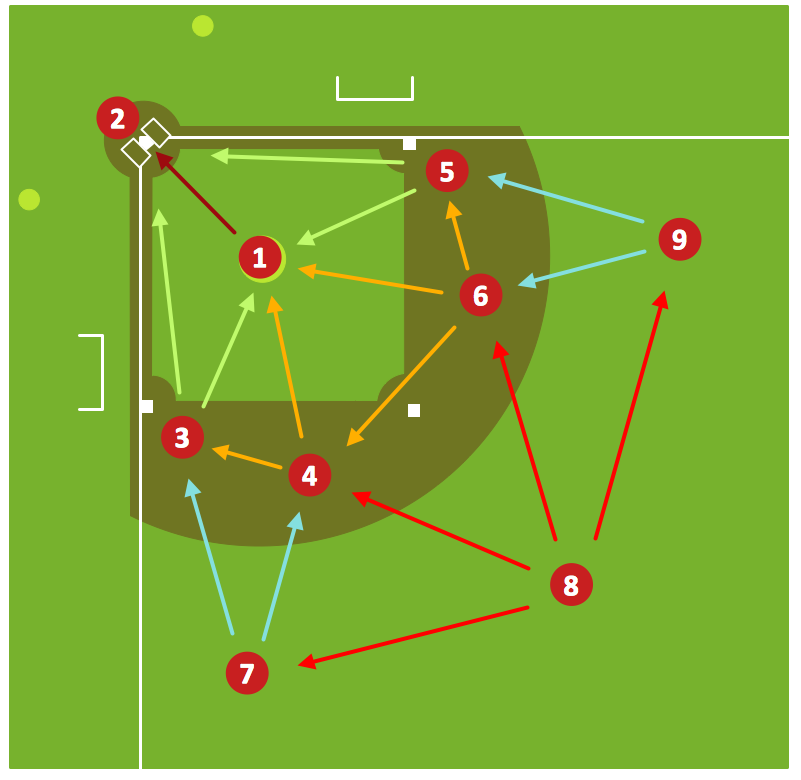
Using diagrams is the easiest way to explain Baseball rules and details. The Baseball solution for ConceptDraw PRO contains a set of samples depicts helpful baseball diagrams examples. Using embedded presentation tools you are able to share your baseball knowledge with wide audience.ERD Symbols and Meanings
Entity Relationship Diagram (ERD) is a popular software engineering tool for database modeling and illustration the logical structure of databases, which uses one of two notations - Chen's or Crow’s Foot. Crow's foot notation is effective when used in software engineering, information engineering, structured systems analysis and design. Each of these notations applies its own set of ERD symbols. Crow's foot diagrams use boxes to represent entities and lines between these boxes to show relationships. Varied shapes at the ends of lines depict the cardinality of a given relationship. Chen's ERD notation is more detailed way to represent entities and relationships. ConceptDraw PRO application enhanced with all-inclusive Entity-Relationship Diagram (ERD) solution allows design professional ER diagrams with Chen's or Crow’s Foot notation on your choice. It contains the full set of ready-to-use standardized ERD symbols and meanings helpful for quickly drawing, collection of predesigned ERD samples, examples and templates. ConceptDraw Pro is a great alternative to Visio for Mac users as it offers more features and can easily handle the most demanding professional needs.
 Timeline Diagrams
Timeline Diagrams solution extends ConceptDraw PRO diagramming software with samples, templates and libraries of specially developed smart vector design elements of timeline bars, time intervals, milestones, events, today marker, legend, and many other elements with custom properties, helpful for professional drawing clear and intuitive Timeline Diagrams. Use it to design simple Timeline Diagrams and designate only the main project stages, or highly detailed Timeline Diagrams depicting all project tasks, subtasks, milestones, deadlines, responsible persons and other description information, ideal for applying in presentations, reports, education materials, and other documentation.
- Diagram Of A Hockey Pitch And Labelled
- Draw And Label A Hockey Pitch
- Well Labelled Diagram Of An Hockey Pitch
- Diagram Of Hockey Pitch And Stick With Labelling
- Draw And Label A Well Standard Hockey Pitch
- Draw A Well Labelled Diagram Of Hockey Stick And Hockey Pitch
- Draw A Well Labelled Diagram Of A Hockey Field With Their
- Diagram Of Hockey Field And Label
- Winter Sports | Chemistry | Draw And Label A Hockey Pitch The ...
- Labelled Diagram Of Hockey Field
