Business Diagram Software


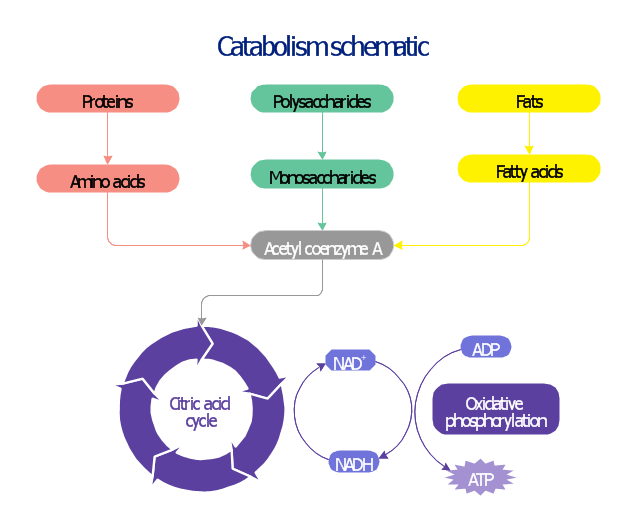
This biochemical chart display how proteins, polysaccharides and fats from food are digested into gastrointestinal tract into aminoacids, monosaccharides and fatty acids, and then broken down and oxidized to carbon dioxide and water in cellular processes of energy generation.
This metabolic pathway map was redesigned from Wikipedia file: Catabolism schematic.svg. [en.wikipedia.org/ wiki/ File:Catabolism_ schematic.svg]
The biochemical diagram example "Catabolism schematic" was created using the ConceptDraw PRO diagramming and vector drawing software extended with the Biology solution from the Science and Education area of ConceptDraw Solution Park.
Catabolic pathway map
- Drawing Illustration | Drawing a Nature Scene | Water Cycle |
- Business Diagram Software | Physics | ConceptDraw Arrows10 ...
- Biochemical metabolic pathway map diagram | Glucose catabolism ...
- Bio Flowchart Lite | Biology | Biochemical metabolic pathway map ...
- Conventional energy resources | Resources and energy vector ...
- Drawing a Nature Scene | Drawing Illustration | Water Cycle |
- Catabolism schematic | Biochemical metabolic pathway map diagram |
- Physics | Language Learning | Astronomy |
- Business Diagram Software | Physics | Simple & Fast Diagram ...
- LLNL Flow Charts | Business Diagram Software | Basic Flowchart ...
- How To Share Presentation via Skype | Biochemical metabolic ...
- Business Diagram Software | Org chart - University | Business ...
- Business Diagram Software | Glucose catabolism pathways map ...
- Biochemical pathway map - Key metabolic processes |
- Chemistry | Design elements - Chemical elements | Carbonyl ...
- Design elements - Biochemistry of metabolism | Business Diagram ...
- Glycolysis overview diagram
- Flowchart Software | DroidDia prime | Pyramid Diagram |
- Glycolysis overview diagram | Catabolism schematic | Glucose ...
- Business Diagram Software | Catabolism schematic |