Basic Diagramming
Create flowcharts, organizational charts, bar charts, line graphs, and more with ConceptDraw DIAGRAM.
Basic Diagramming
Block diagrams are essentially a very simple format of diagrams. A variety of commonly used shapes and connecting lines, rules of construction and actions pertaining to them, make Block diagram a versatile and flexible tool for many forms of industry. Another advantage is the ease with which Block diagrams can be constructed, especially if you use professional diagramming software. ConceptDraw DIAGRAM software is an example of purpose built application designed with the form of process modeling in mind. It includes Block Diagrams solution from Diagrams area of ConceptDraw Solution Park for easy drawing professional-looking simple diagram - Block diagram, and a lot of other useful solutions for designing variety of other types of diagrams, schematics and flowcharts (Line graphs, Bar charts, Organizational charts, Histograms, Pie charts, Process flowcharts, Fault tree analysis diagrams, Scatter plots, Venn diagrams, Bubble diagrams, etc.). The RapidDraw functionality of ConceptDraw DIAGRAM lets create new objects and their connectors in just single-click.
Sales Growth. Bar Graphs Example
This sample was created in ConceptDraw DIAGRAM diagramming and vector drawing software using the Bar Graphs Solution from Graphs and Charts area of ConceptDraw Solution Park. It is Bar Graphs example, Sales Growth example, Column Chart Example - Sales Report.Growth-Share Matrix Software
Growth-Share Matrix Software - ConceptDraw DIAGRAM is a powerful diagramming and vector drawing software for creating professional looking Growth–Share Matrices. For simple and quick creating the Growth–Share Matrix ConceptDraw DIAGRAM offers the Matrices Solution from the Marketing Area of ConceptDraw Solution Park. The Matrices Solution also provides a wide variety of templates and samples that will help you to create the Matrix diagrams of any difficulty.Organizational Chart Templates
ConceptDraw offers you a number of ready-made organizational chart templates which you can use in your drawing. They are grouped in topical sets as organizational chart template files. Use the Organizational Charts Solution for ConceptDraw DIAGRAM to create your own Organizational Charts of any complexity quick, easy and effective. The Organizational Charts designed with ConceptDraw DIAGRAM are vector graphic documents and are available for reviewing, modifying, converting to a variety of formats (image, HTML, PDF file, MS PowerPoint Presentation, Adobe Flash or MS Visio XML), printing and send via e-mail in one moment.
Business diagrams & Org Charts with ConceptDraw DIAGRAM
The business diagrams are in great demand, they describe the business processes, business tasks and activities which are executed to achieve specific organizational and business goals, increase productivity, reduce costs and errors. They let research and better understand the business processes. ConceptDraw DIAGRAM is a powerful professional cross-platform business graphics and business flowcharting tool which contains hundreds of built-in collections of task-specific vector stencils and templates. They will help you to visualize and structure information, create various Business flowcharts, maps and diagrams with minimal efforts, and add them to your documents and presentations to make them successful. Among them are Data flow diagrams, Organization charts, Business process workflow diagrams, Audit flowcharts, Cause and Effect diagrams, IDEF business process diagrams, Cross-functional flowcharts, PERT charts, Timeline diagrams, Calendars, Marketing diagrams, Pyramids, Target diagrams, Venn diagrams, Comparison charts, Analysis charts, Dashboards, and many more. Being a cross-platform application, ConceptDraw DIAGRAM is very secure, handy, free of bloatware and one of the best alternatives to Visio for Mac users.
Sales Dashboards for Your Company
ConceptDraw DIAGRAM software extended with the Sales Dashboard solution allows you produce sales dashboards for your company easily. You can start from samples and templates delivered with the solution and then modify them to get a dashboard that suites your specific needs.SWOT analysis Software & Template for Macintosh and Windows
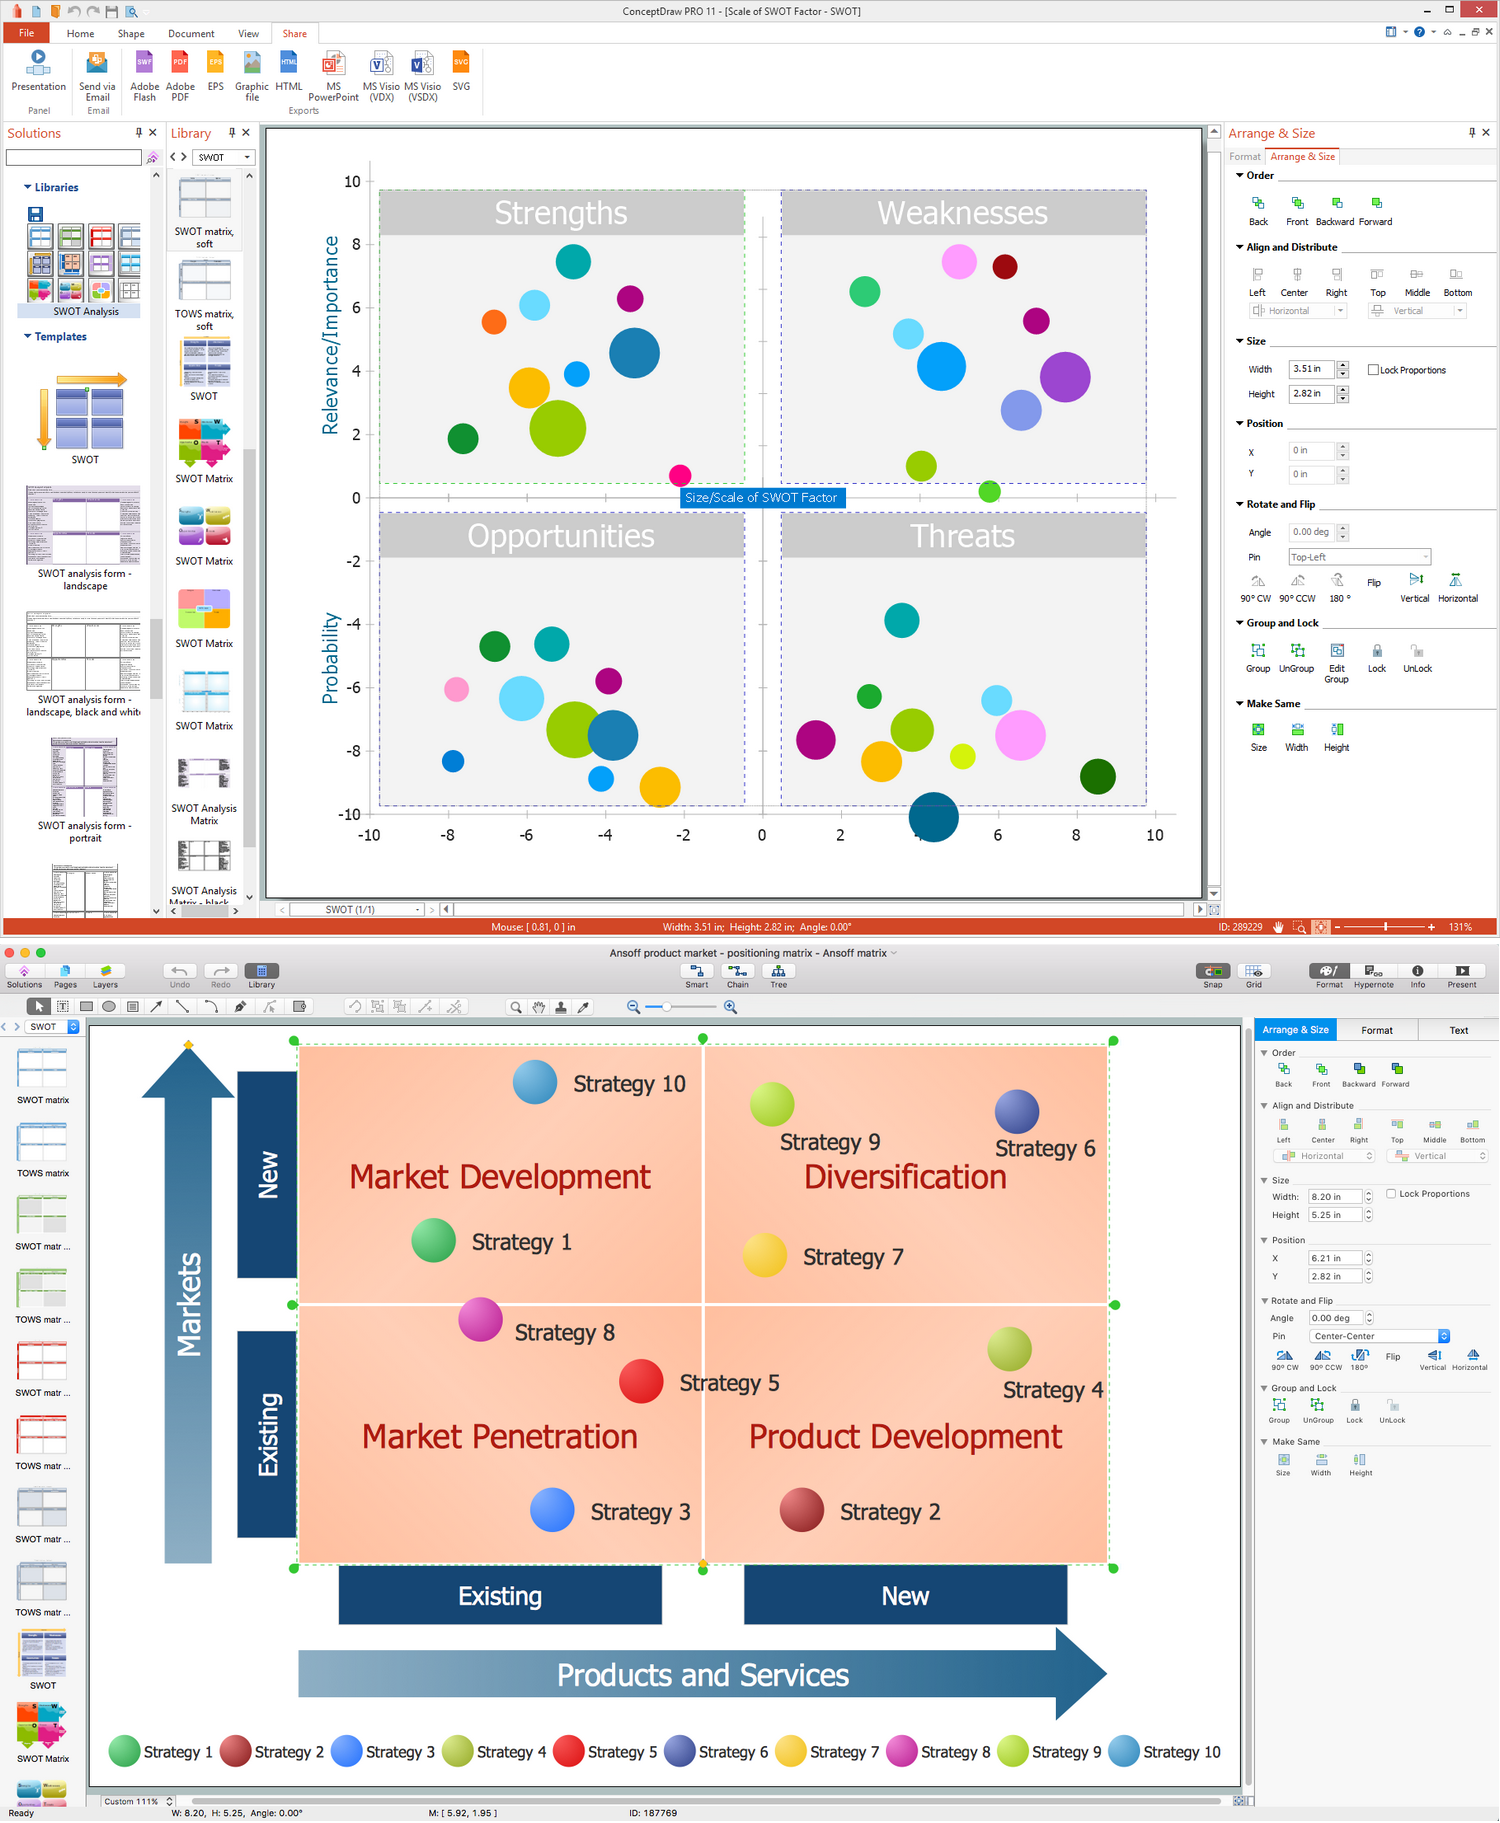
Experienced businessmen and professional marketing specialists know that the success in business largely depends on the chosen company's development strategy. To develop a correct development and promotion strategy for each individual business enterprise is needed a SWOT analysis. It is used to prepare marketing strategies for growing your business in the right direction, helps to develop the strategic alternative in the field of staff management and logistics, assists to know the strengths and weaknesses of the company, and also to identify the factors that affect the industry as a whole and this company in particular. Professional SWOT analysis is often holding by consulting companies. SWOT analysis is that tool which lets you make your business more successful. Realize it easily using professional SWOT analysis software developed for Macintosh and Windows OS - ConceptDraw DIAGRAM. Enhanced with SWOT and TOWS Matrix Diagrams solution, ConceptDraw DIAGRAM offers a lot of predesigned vector stencils for SWOT analysis, quick-start templates, useful SWOT samples and TOWS examples.Chart Templates
Easy charting software comes with beautiful chart templates and examples. This makes it easy to create professional charts without prior experience.Ansoff Matrix
ConceptDraw DIAGRAM software extended with Matrices Solution from the Marketing Area of ConceptDraw Solution Park offers you the possibility to develop the Ansoff Matrix of any complexity.Bar Diagrams for Problem Solving. Create manufacturing and economics bar charts with Bar Graphs Solution
Create bar charts for visualizing problem solving in manufacturing and economics using the ConceptDraw DIAGRAM diagramming and vector drawing software extended with the Bar Graphs Solution from the Graphs and Charts area of ConceptDraw Solition Park.Bar Diagrams for Problem Solving. Create space science bar charts with Bar Graphs Solution
Bar charts represent data in different categories or groups. Create bar graphs for visual solving your scientific problems and data comparison using the ConceptDraw DIAGRAM diagramming and vector drawing software extended with the Bar Graphs Solution from the Graphs and Charts area of ConceptDraw Solition Park.SWOT Matrix Software
The SWOT Analysis solution from the Management area of ConceptDraw Solution Park contains set of examples, templates and vector design elements of SWOT and TOWS matrices. It helps you to quickly draw SWOT and TOWS analysis matrix diagrams using the best SWOT matrix software ConceptDraw DIAGRAM.Financial Comparison Chart
This sample shows the Bar Chart of the leverage ratios for two major investment banks. The leverage ratio is the ratio of the total debt to the total equity; it is a measure of the risk taken by the bank. The higher of the leverage ratio denotes the more risk, the greater risks can lead to the subprime crisis.125 Ways to Integrate Social Media to Increase Your Business
The social network services and social media are actively used in the modern business world to promote products and services to the market, and effectively communicate with customers. They are the most simple and effective way of setting the feedbacks, allow to organize effectively a dialogue with consumers, to provide for potential consumers the necessary information about a given product or service, and collect effortlessly the valuable reviews and opinions from the real customers. The social media allow you to read and analyze the information about different products, to compare them, to make the predictions about interesting products for particular categories of potential clients. This Mind Map designed in ConceptDraw MINDMAP illustrates 125 ways to integrate the social media to increase your business. The modern social media approaches to business marketing can be easy presented to others using the ConceptDraw MINDMAP application and the eLearning for Skype solution from ConceptDraw Solution Park.Bar Diagrams for Problem Solving. Create business management bar charts with Bar Graphs Solution
Create bar charts for business management problem solving and data comparison using the ConceptDraw DIAGRAM diagramming and vector drawing software extended with the Bar Graphs Solution from the Graphs and Charts area of ConceptDraw Solition Park.Draw Flowcharts with ConceptDraw
Start design your own flowchart with ConceptDraw DIAGRAM and accomplish great results at the moment.Pyramid Diagram and Pyramid Chart
Pyramid Diagram, Triangle Chart or Triangular Diagram is a convenient and useful type of diagrams, which lets represent the data hierarchical structure and to illustrate the foundation-based relationships between the hierarchy levels. Pyramid Diagrams are used to visualize effectively the hierarchical, as well as proportional and foundation-based relationships, the process steps, the interconnections of organizational layers or topics. ConceptDraw DIAGRAM software enhanced with Pyramid Diagrams solution from Marketing area of ConceptDraw Solution Park is a powerful business charting software, that includes all required tools for designing the multilevel Pyramid Diagrams as quickly as possible. The build-in vector stencils and templates are the great aid for designers, a variety of examples and samples is a good base and source of inspiration. Use attractive and vivid 2D and 3D Pyramid Diagrams and Triangle Charts designed in ConceptDraw DIAGRAM to illustrate your documents, presentations, infographics, articles, reports, websites, etc.Chart Examples
Easy charting software comes with beautiful chart templates and examples. This makes it easy to create professional charts without prior experience.SWOT analysis matrix diagram templates
SWOT analysis or SWOT Matrix is a structured method of the planning which is used to evaluate the S - Strengths, W - Weaknesses, O - Opportunities, and T - Threats involved in a business project or commercial venture. It was introduced at 1960s as a tool for learning the internal capabilities of large companies. A SWOT analysis includes the indication of the project's goal, specification the critical factors (internal and external) that influence on the achievement of company's business goal, that are conducive or adverse for this. SWOT analysis is effective way to successful business, to win in rivalry with competitors and become the best on your market. SWOT Analysis solution from Management area of ConceptDraw Solution Park makes the ConceptDraw DIAGRAM a powerful SWOT and TOWS analysis software. It contains a lot of vector design elements of SWOT and TOWS matrices, numerous examples and templates. The predesigned SWOT example or template is a fastest way of drawing professional-looking SWOT Matrix and presenting analysis results in just one click.- Economics Graph Maker Software Free Download
- Financial Comparison Chart | Bar Diagrams for Problem Solving ...
- Business people pictograms - Vector stencils library | Business ...
- KPI Dashboard | Performance Indicators | Dashboard | Marketing ...
- Boston growth -share matrix - Template | BCG Matrix | Boston growth ...
- How To Make a Concept Map | Concept Mapping | The Best Mac ...
- Bar Chart Software | Bar Chart Examples | Bar Chart Template for ...
- Sales Growth . Bar Graphs Example | Basic Diagramming | Bar ...
- Pie Chart Software | Chart Maker for Presentations | Pie Chart ...
- Business Process Diagrams | Business and Finance | Money ...
- Flowchart Software | Spider Chart Template | Pie Chart Word ...
- Process Flowchart | Chart Maker for Presentations | Sales Growth ...
- Business diagrams & Org Charts with ConceptDraw PRO | Sales ...
- Hire Purchase Software Free Download
- ConceptDraw Software Full Versions Free Download | How to Use ...
- Chart Maker for Presentations | Competitor Analysis | Pyramid ...
- Block Diagram Of Population Growth
- Flowchart Example: Flow Chart of Marketing Analysis | Marketing ...
- ConceptDraw Arrows10 Technology | How to Add Different ...
- SWOT analysis matrix diagram templates | SWOT Template | SWOT ...


