Sales Growth. Bar Graphs Example

Basic Diagramming


Bar Diagrams for Problem Solving. Create event management bar charts with Bar Graphs Solution

Pictures of Graphs

Picture Graph

 Line Graphs
How to draw a Line Graph with ease? The Line Graphs solution extends the capabilities of ConceptDraw PRO v10 with professionally designed templates, samples, and a library of vector stencils for drawing perfect Line Graphs.
Bar Diagrams for Problem Solving. Create manufacturing and economics bar charts with Bar Graphs Solution

 Picture Graphs
Typically, a Picture Graph has very broad usage. They many times used successfully in marketing, management, and manufacturing. The Picture Graphs Solution extends the capabilities of ConceptDraw PRO v10 with templates, samples, and a library of professionally developed vector stencils for designing Picture Graphs.
The scatter chart example "MENA's (Middle East and North Africa's) real GDP growth" depicts data from the European Economic Forecast (EUROPEAN ECONOMY 1|2013, Economic and Financial Affairs Winter 2013, European Commission) [ec.europa.eu/ economy_ finance/ publications/ european_ economy/ 2013/ pdf/ ee1_ en.pdf].
"The term MENA, for "Middle East and North Africa", is an acronym often used in academic, military planning, disaster relief, and business writing.
Due to the geographic ambiguity and Eurocentric nature of the term "Middle East", many people prefer use of the term WANA (West Asia and North Africa) or the less common NAWA (North Africa-West Asia).
The term covers an extensive region, extending from Morocco to Iran, including the majority of both the Middle Eastern and Maghreb countries. The term is roughly synonymous with the term the Greater Middle East. ...
MENA has no standardized definition; different organizations define the region as consisting of different territories. The following is a list of commonly included countries and territories: Bahrain, Egypt, Iran, Iraq, Israel, Jordan, Kuwait, Lebanon, Yemen, United Arab Emirates, Libya, Morocco, Oman, West Bank and Gaza, Qatar, Saudi Arabia, Syria, Tunisia, Algeria.
Sometimes also included in broader definitions: Armenia, Azerbaijan, Cyprus, Djibouti, Mauritania, Somalia, Sudan, Turkey, Western Sahara.
" [MENA. Wikipedia]
The scatter chart example "MENA's (Middle East and North Africa's) real GDP growth" was created using the ConceptDraw PRO diagramming and vector drawing software extended with the Line Graphs solution from the Graphs and Charts area of ConceptDraw Solution Park.
Scatter graph
-real-gdp-growth---scatter-chart.png--diagram-flowchart-example.png)
Ansoff Matrix

 Area Charts
Area Charts are used to display the cumulative totals over time using numbers or percentages; or to show trends over time among related attributes. The Area Chart is effective when comparing two or more quantities. Each series of data is typically represented with a different color, the use of color transparency in an object’s transparency shows overlapped areas and smaller areas hidden behind larger areas.
BCG Matrix

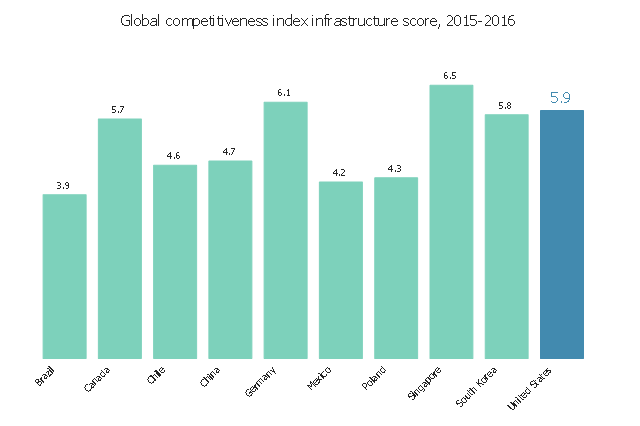
The example bar graph "Global competitiveness index infrastructure score chart, 2012-2013" was redesigned from the website "Assess Costs Everywhere" of the United States Department of Commerce. [acetool.commerce.gov/ shipping]
"The Global Competitiveness Report (GCR) is a yearly report published by the World Economic Forum. Since 2004, the Global Competitiveness Report ranks countries based on the Global Competitiveness Index, developed by Xavier Sala-i-Martin and Elsa V. Artadi. Before that, the macroeconomic ranks were based on Jeffrey Sachs's Growth Development Index and the microeconomic ranks were based on Michael Porter's Business Competitiveness Index. The Global Competitiveness Index integrates the macroeconomic and the micro/ business aspects of competitiveness into a single index." [Global Competitiveness Report. Wikipedia]
The example "Global competitiveness index infrastructure score chart, 2012-2013" was created using the ConceptDraw PRO diagramming and vector drawing software extended with the Bar Graphs solution from the Graphs and Charts area of ConceptDraw Solution Park.
www.conceptdraw.com/ solution-park/ charts-bar-graphs
Horizontal Bar Graph
 Frequency Distribution Dashboard
Frequency distribution dashboard solution extends ConceptDraw PRO software with samples, templates and vector stencils libraries with histograms and area charts for drawing the visual dashboards showing frequency distribution of data.
Growth-Share Matrix Software

The Matrices Solution also provides a wide variety of templates and samples that will help you to create the Matrix diagrams of any difficulty.
- Sales Growth . Bar Graphs Example | Bar Chart Examples | Bar ...
- Pictures of Graphs | Picture Graph | Area Charts | Show Business ...
- Create Graphs and Charts | Sales Growth . Bar Graphs Example ...
- Free Ppt Sample Templates With Graphs And Charts
- Sales Growth . Bar Graphs Example | Create Graphs and Charts ...
- Pie Chart | Business Report Pie. Pie Chart Examples | Line Chart ...
- Create Graphs and Charts | Line Graph Charting Software | Polar ...
- Sales Growth . Bar Graphs Example | Sales Dashboard | Sales ...
- Business Graphs And Charts Examples Image
- Bar Chart Examples | Bar Chart Software | Sales Growth . Bar Graphs ...
- Free Business Charts And Graphs
- Sales Growth . Bar Graphs Example | Bar Chart Examples | Create ...
- Bar Graphs | Sales Growth . Bar Graphs Example | How to Create a ...
- Sales Growth . Bar Graphs Example | Bar Diagrams for Problem ...
- Graph Which Shows The Flow Of Business Growth
- Basic Business Graphs
- Sales Growth . Bar Graphs Example | Bar Graphs | Bar Chart ...
- Business Plan Template With Graphs And Charts
- Sales Growth . Bar Graphs Example | Bar Chart Examples | Bar ...