How To Create Onion Diagram

Use this onion diagram template with ConceptDraw PRO software to design your stakeholder diagrams.
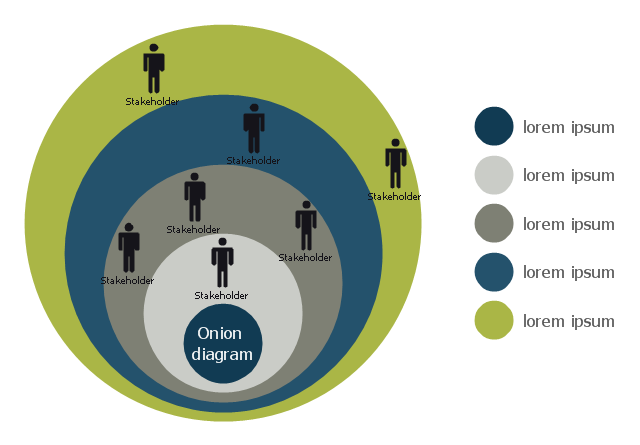
"The Onion Diagram is able to show layers of a complete system in a few circles. Each of the circles is able to represent a component that is dependent upon the component on the inside of it shown by the circle inside of it. The main concept of the diagram is shown by the center circle of the diagram. This chart is used due to the fact that it has a clear visual representation that is easy to read, and it has a strong visual impact." [Onion diagram. Wikipedia]
The stakeholder diagram template "Round onion diagram" is included in the Stakeholder Onion Diagrams solution from the Management area of ConceptDraw Solution Park.
Stakeholder diagram
Stakeholder Onion Diagram Template

Gane Sarson Diagram

TQM Software — Build Professional TQM Diagrams

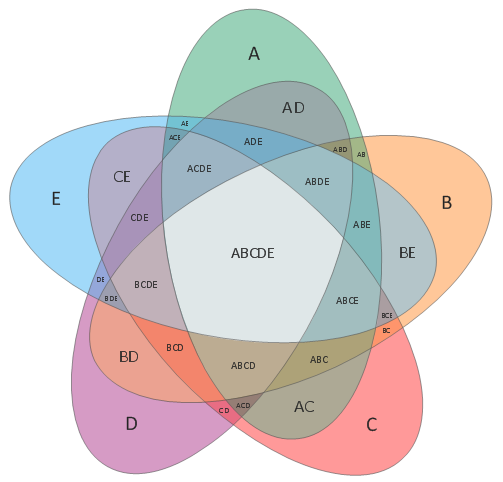
Venn Diagram Template
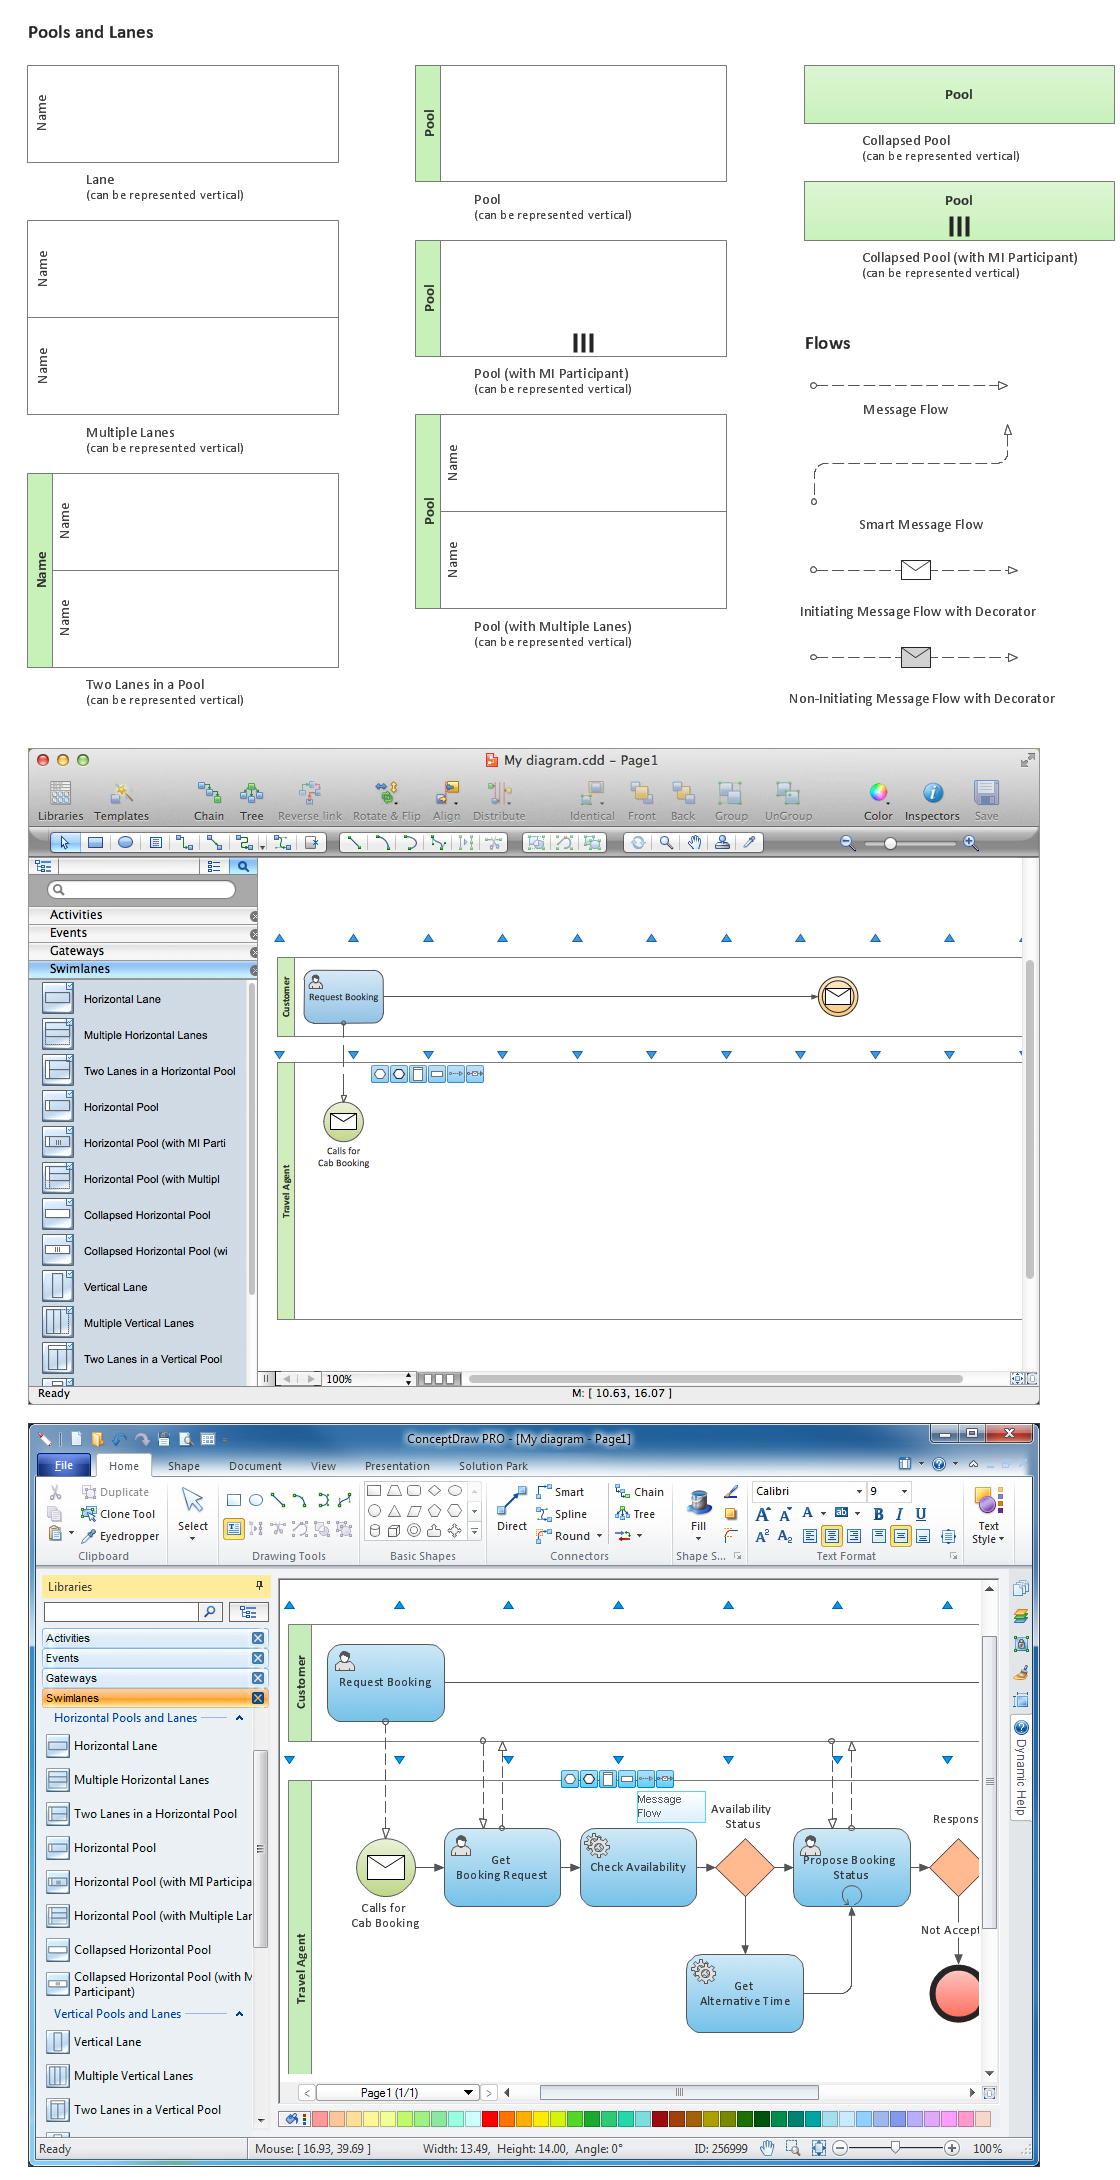
BPMN 2.0

Diagramming Software for Design Business Process Diagrams

Bar Diagrams for Problem Solving. Create manufacturing and economics bar charts with Bar Graphs Solution

Target Diagram

Visio Files and ConceptDraw

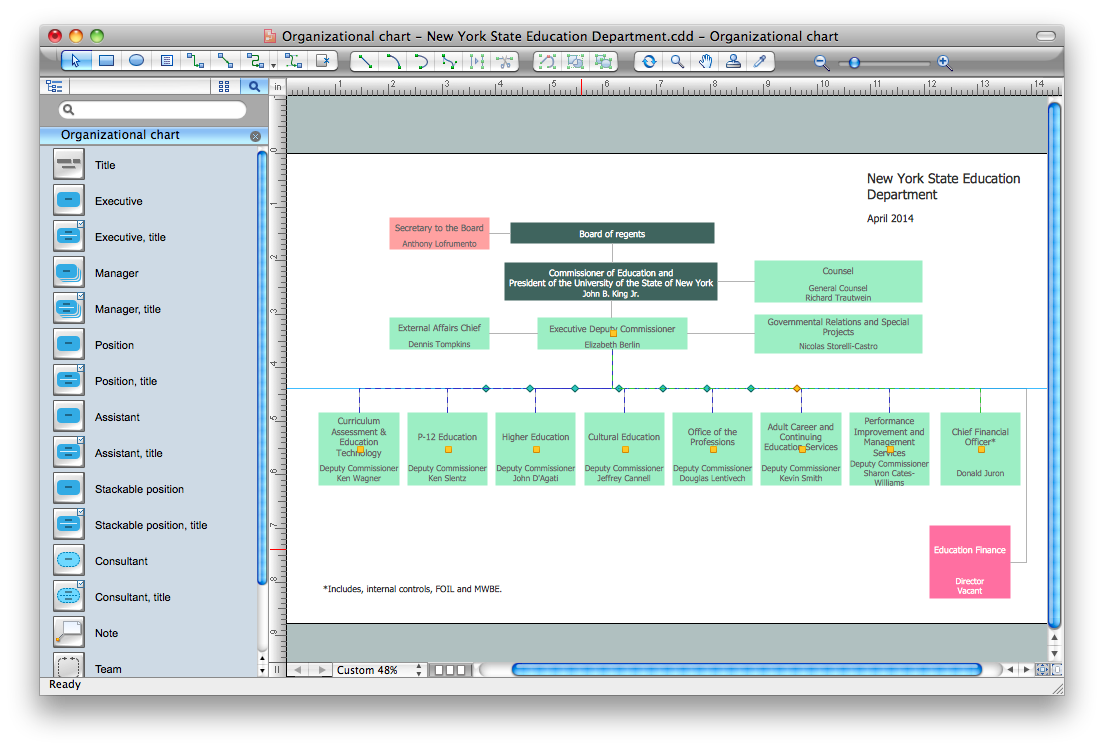
Organization Chart Software

 Telecommunication Network Diagrams
Telecommunication Network Diagrams solution extends ConceptDraw DIAGRAM software with samples, templates, and great collection of vector stencils to help the specialists in a field of networks and telecommunications, as well as other users to create Computer systems networking and Telecommunication network diagrams for various fields, to organize the work of call centers, to design the GPRS networks and GPS navigational systems, mobile, satellite and hybrid communication networks, to construct the mobile TV networks and wireless broadband networks.
 Enterprise Architecture Diagrams
Enterprise Architecture Diagrams solution extends ConceptDraw DIAGRAM software with templates, samples and library of vector stencils for drawing the diagrams of enterprise architecture models.
Affinity Diagram

- How To Create Onion Diagram | Onion Diagram Maker | How to ...
- Target market - Onion diagram | Target diagrams - Vector stencils ...
- Marketing mix - Wheel diagram | Target market - Onion diagram ...
- Circle-spoke diagram - Target market | Target market - Onion ...
- Process Flowchart | Onion Diagram Process Design | Flowchart ...
- Physics Diagrams | Venn Diagram Maker | Onion Diagram Maker ...
- Onion Diagram Templates | How To Create Onion Diagram ...
- Stakeholder Onion Diagram Template | Business diagrams & Org ...
- Sector diagram - Template | Stakeholder Onion Diagrams | How To ...
- Sector diagram - Template | How To Create Onion Diagram ...
- Sector diagram - Template | How To Create Onion Diagram | Pie ...
- Marketing mix - Wheel diagram | Marketing mix diagram | Target ...
- Process Flowchart | Types of Flowcharts | Onion Diagram Process ...
- Sector diagram - Template | Process Flowchart | How To Create ...
- Bubble Chart Maker | Physics Diagrams | Onion Diagram Maker ...
- Target and Circular Diagrams | Design elements - Circular diagrams ...
- Process Flowchart | Pie Chart Software | Onion Diagram Process ...
- Pyramid Diagram | Stakeholder Onion Diagrams | Explain Layers Of ...
- Diagrammatic Representation Of A Project Proposal
- Process Flowchart | Onion Diagram Maker | Flowcharting Software ...