Physics Diagrams

Venn Diagram Maker

Onion Diagram Maker

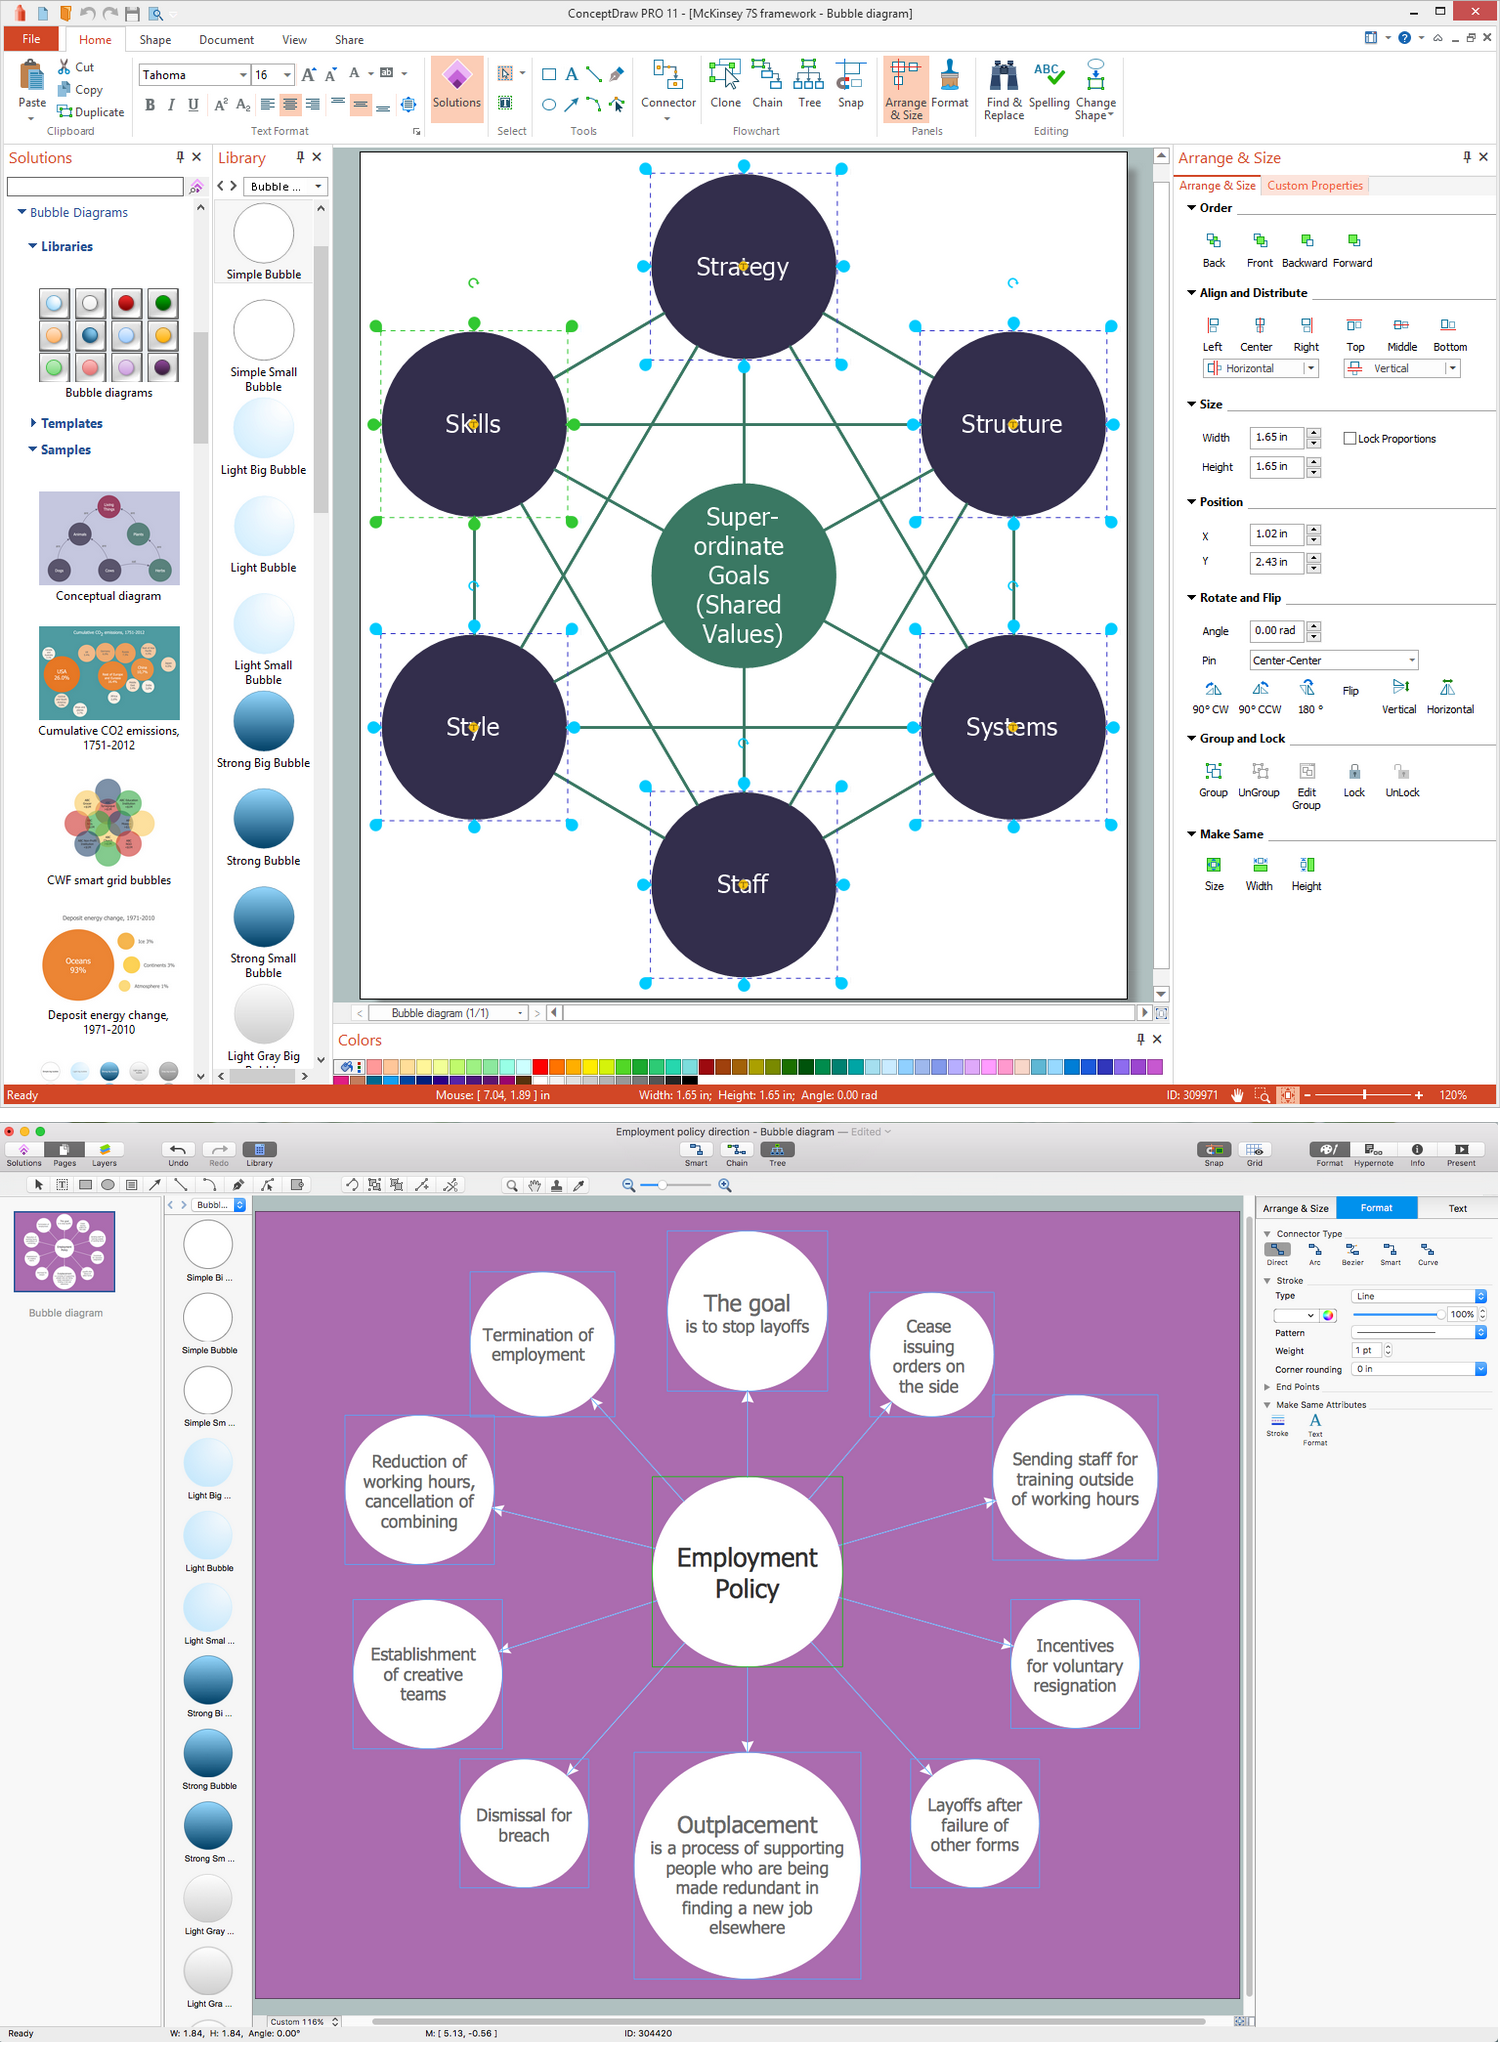
Bubble Chart Maker
Classroom Seating Chart Maker

Entity Relationship Diagram - ERD - Software for Design Crows Foot ER Diagrams
_Win_Mac.png)

Energy Pyramid Diagram

Bubble Map Maker

Flow Chart Online

HelpDesk
How to a Draw Biology Diagram

Chart Maker for Presentations

Onion Diagram Templates

Pyramid Diagram and Pyramid Chart

- Venn Diagram Maker | Venn Diagram Template for Word | 4-Set ...
- Venn Diagram Maker | Venn Diagrams | Venn Diagram Template for ...
- Multi Layer Venn Diagram . Venn Diagram Example | Venn Diagram ...
- Bubble Chart Maker | How to Draw a Bubble Chart | Bubble ...
- Venn Diagram | Design elements - Venn diagrams | Venn Diagram ...
- Physics Diagram Maker
- Onion Diagram Maker | Onion Diagram Templates | Stakeholder ...
- Stakeholder Onion Diagram Template | Onion Diagram Maker ...
- Business Productivity Diagramming | Fishbone Diagram | Ishikawa ...
- Visualize Stakeholder Analysis | Stakeholder Mapping Tool | Onion ...
- Research Onion Diagrams
- Research Onion Diagram
- Onion Diagram Maker | The Circular Flow Diagram | Matrix ...
- Stakeholder Onion Diagram Template
- Stakeholder Onion Diagram Template | Stakeholder Mapping Tool ...
- Venn Diagrams | Venn Diagram | How to Create a Venn Diagram in ...
- How to Draw a Bubble Chart | How To Create a Bubble Chart | How ...
- Architectural Bubble Diagram Maker
- Sentence Diagram Maker
- 3 Circle Venn Diagram Maker