Flow chart Example. Warehouse Flowchart
Warehouse Flowcharts are various diagrams that describe the warehousing and inventory management processes on the warehouses. Typical purposes of Warehouse Flowcharts are evaluating warehouse performance, measuring efficiency of customer service and organizational performance. This type of Workflow diagrams can be used for identifying any disconnection between business activities and business objectives. They are effectively used by warehouse-related people and organizations, manufacturers, wholesalers, exporters, importers, transporters, and others. Standard Warehousing process flow diagram and standard Workflow diagram are used for process identification for further evaluating effectiveness and profitability of overall business process. Use the ConceptDraw PRO vector graphic software extended with Flowcharts solution to design your own professional-looking Workflow diagrams and Flowcharts of any types, including the Warehouse flowchart, Process flow diagrams which depict in details all steps of Warehouse packages flow. Microsoft Visio, designed for Windows users, can’t be opened directly on Mac. But fortunately, there are several Visio alternatives for Mac which will help Mac users to work Visio files. With ConceptDraw PRO, you may open, edit and save files in Visio format.
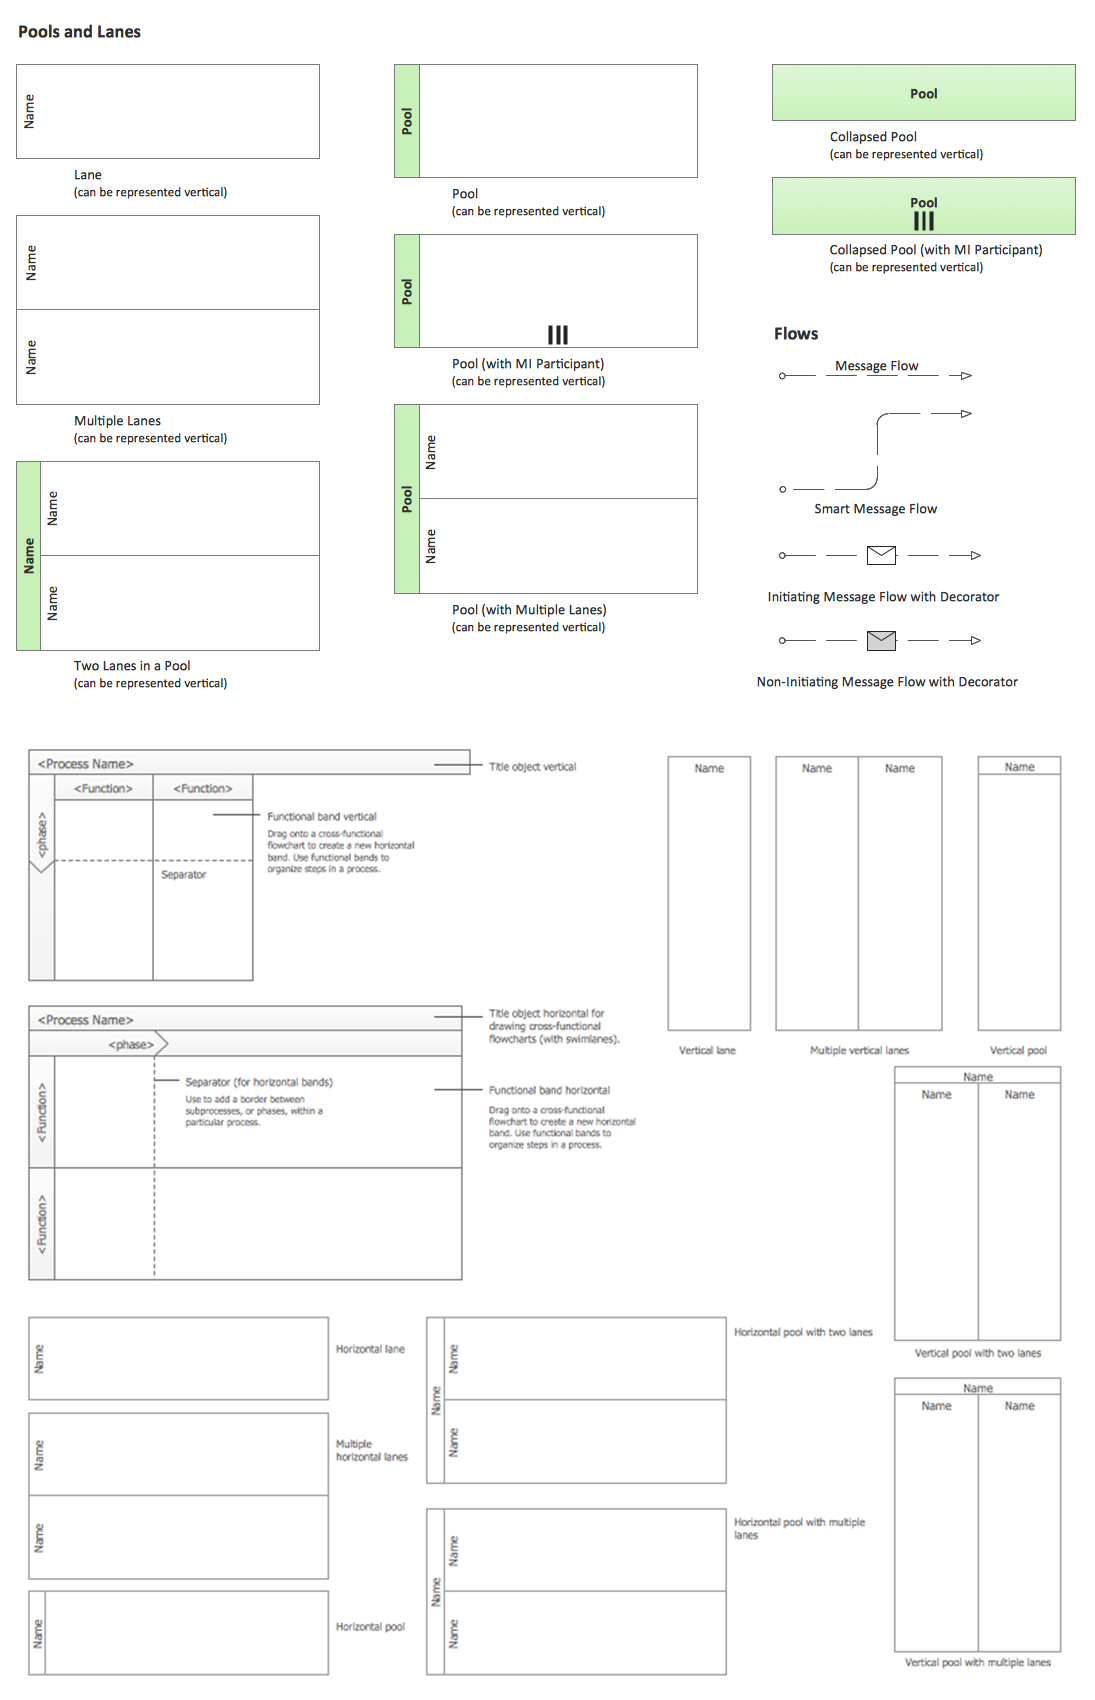
Business Process Elements: Swimlanes
ConceptDraw has 142 vector stencils in the 8 libraries that helps you to start using software for designing own Business Process Diagrams. Use Swimlanes library with 20 objects from BPMN.
Jacobson Use Cases Diagram
The vector stencils library UML Use Case contains specific symbols of the UML notation such as actors, actions, associations and relationships for the ConceptDraw PRO diagramming and vector drawing software. This library is contained in the Rapid UML solution from Software Development area of ConceptDraw Solution Park.The Best Business Process Modeling Software
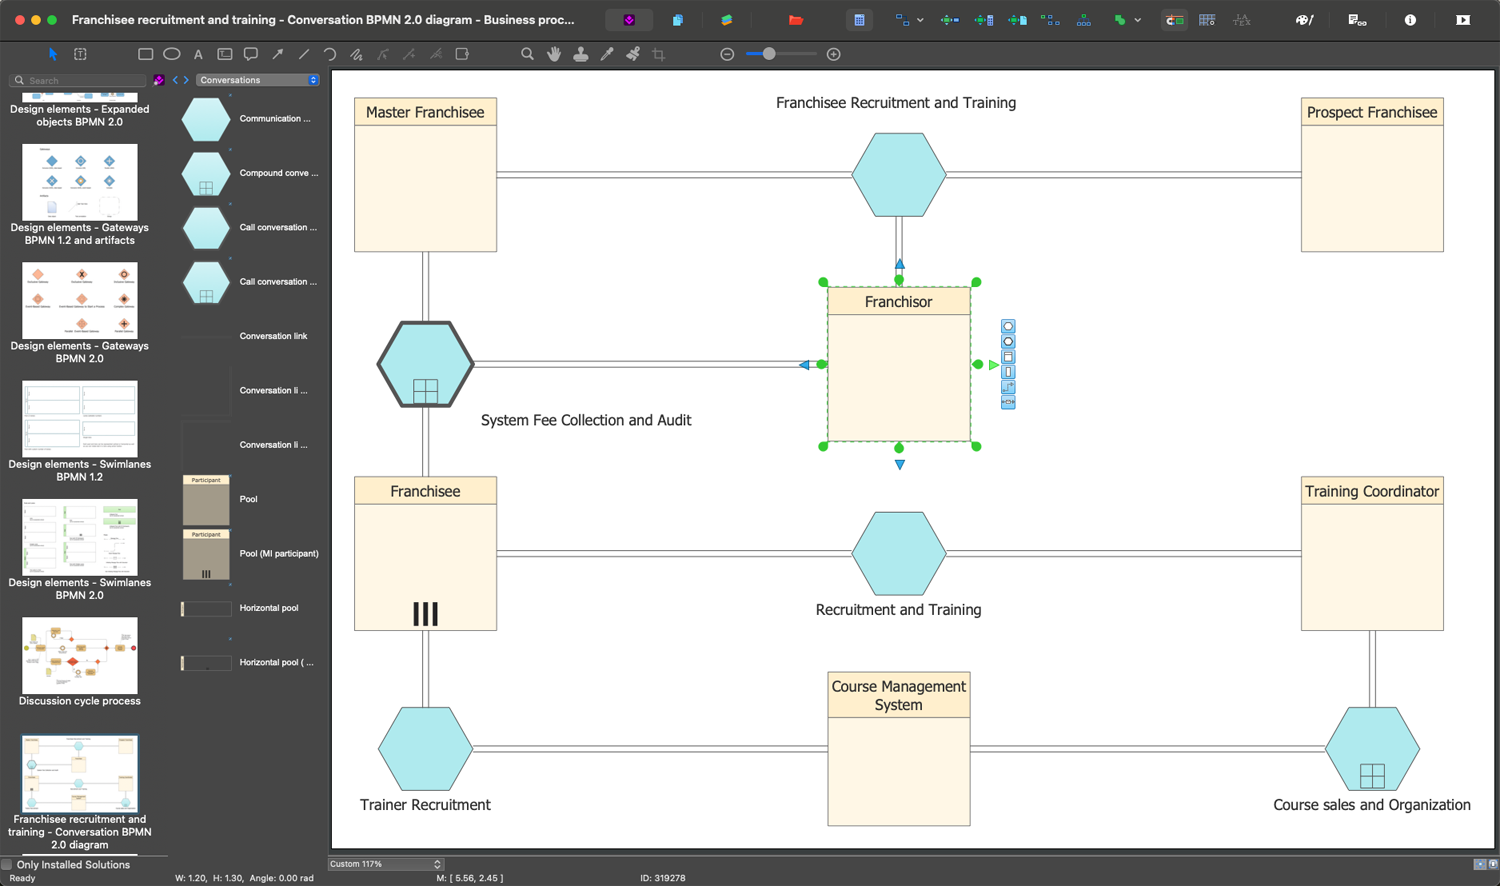
ConceptDraw PRO is a best business processes modeling software for graphical documenting processes of the company. ConceptDraw has 142 vector stencils in the 8 libraries that helps you to start using Diagramming Software for designing own Business Process Diagrams.
Flowchart Components
The ConceptDraw Flowchart component includes a set of samples and templates. This geathered as flowchart maker toolbox which focused on drawing flowcharts of any industry standards.Venn Diagram Examples for Problem Solving. Environmental Social Science. Human Sustainability Confluence
The Venn diagram example below shows sustainable development at the confluence of three constituent parts. Create your Venn diagrams for problem solving in environmental social science using the ConceptDraw PRO diagramming and vector drawing software extended with the Venn Diagrams solution from the area "Diagrams" of ConceptDraw Solution Park.Business Process Management
ConceptDraw RapidDraw technology is a simple point-and-click design that helps create professional, presentation-ready business process diagrams quickly and efficiently.Flowchart Example: Flow Chart of Marketing Analysis
An example flowchart of marketing analysis shows main steps you have to challenge writing a marketing analysis.Example of Flowchart Diagram
ConceptDraw - feature-rich flowchart software. This software includes flowchart diagram examples set. Libraries contain vector stencils that allow users to use RapidDraw technology. Users can start draw their own flowchart diagrams from existing examples by clicking on direction arrows.Cross Functional Flowchart Examples
Take a look on an example of Cross-Functional-Flowchart, showing the software service cross-function process flowcharts among the different departments. It presents a simple flowchart among the customer, sales, technical support, tester and development. Try now Flowchart Software and Cross-Functional library with 2 libraries and 45 vector shapes of the Cross-Functional Flowcharts solution. Then you can use built-in templates to create and present your software service cross-function process flowcharts.Pie Donut Chart. Pie Chart Examples
This sample shows the Pie Donut Chart. It was created in ConceptDraw PRO diagramming and vector drawing software using the ready-to-use object from the Pie Charts Solution from Graphs and Charts area of ConceptDraw Solution Park. The Pie Donut Chart visualizes the percentage of parts of the whole and looks like as a ring divided into sectors. Pie Donut Charts are widely used in the business, statistics, analytics, mass media.How to Draw Pictorial Chart. How to Use Infograms
How to draw pictorial chart quick, easy and effective? ConceptDraw PRO offers the unique Pictorial Infographics Solution that will help you! Pictorial Infographics solution contains large number of libraries with variety of predesigned vector pictograms that allows you design infographics in minutes. There are available 10 libraries with 197 vector pictograms.Gantt Chart Software
The Gantt Chart is the main interface in ConceptDraw PROJECT. It summarizes the tasks in your project and presents them graphically so you can easily view your progress.DFD Library System
The Data Flow Diagram (DFD) is a graphical technique used for effective modeling and analyzing the information processes and systems. Having at the disposal the DFD library system and newest powerful tools of ConceptDraw PRO diagramming and vector drawing software supplied with Data Flow Diagrams (DFD) solution from the Software Development area of ConceptDraw Solution Park, you can design fast and easy the Data flow diagrams, Data flowcharts, Data flow models, Data flow process diagrams, Process-oriented models, Data-oriented models, Data process diagrams, Structured analysis diagrams, Information flow diagrams of any type and complexity. For designing the Data Flow Diagrams in ConceptDraw PRO software are used the simple DFD flowchart symbols from the offered DFD libraries - Data Flow Diagram (DFD) library, Yourdon and Coad Notation library, and Gane-Sarson Notation library. The DFD objects are need to be connected each other by the arrows to depict the data flow from one step to another, that you can do in seconds in ConceptDraw PRO, as well as set desired design of your diagram.Functional Organizational Structure
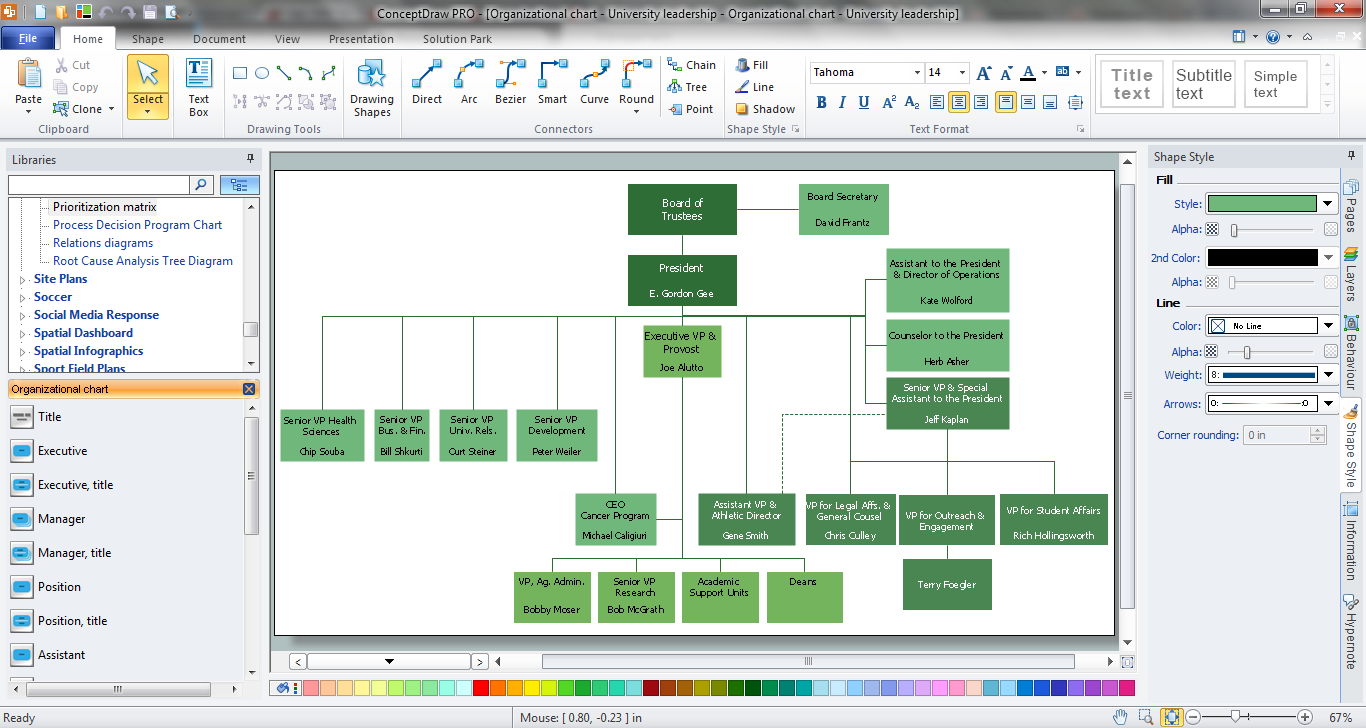
A functional organizational structure is a structure that consists of activities such as coordination, supervision and task allocation. You want to draw a functional organizational structure and look for the helpful software for this? Pay attention for the ConceptDraw PRO software! Extended with Organizational Charts Solution from the Management Area, it is ideal for functional organizational structure development.- Business Activity Flow Chart Example
- Activity Network (PERT) Chart | Flow chart Example. Warehouse ...
- Warehouse Process Flow Diagram Example
- Activity Network Diagram Method | Activity Network (PERT) Chart ...
- Workflow Diagram Examples
- Activities Of Warehouse In A Diagram
- Draw Your Own Diagram And Explain The Activities In Each Sector
- Process Flowchart | Flow chart Example. Warehouse Flowchart ...
- Activity Network (PERT) Chart | Process Flowchart | Flow chart ...
- Flow chart Example. Warehouse Flowchart | Pyramid Diagram ...
- Retail Flow Diagram
- Trading process diagram - Deployment flowchart | Flow chart ...
- Commercial Chart Diagram
- Flow chart Example. Warehouse Flowchart
- Example Of A Flow Diagram
- Warehouse Workflow Diagram
- Issue Management Flow Diagram
- Porter's value chain matrix diagram | Flow chart Example ...
- Activities In A Project Management Software With Example Diagram
- Document Flow Diagram


