How To Create a Workflow Diagram

Use Case Diagrams technology with ConceptDraw PRO

Colored Baseball Field Diagram

ERD Symbols and Meanings


How To use House Electrical Plan Software


Baseball Diagram – Baseball Field – Corner View – Template

Soccer (Football) Dimensions
 Dimensions")
Diagrams Mean Nothing

Timeline charts presents events and time periods on a chronological scale. They are used in project management to visualize project milestones and upper level phases, and show project progress.
"Within the framework of project management, a milestone is an event that receives special attention. It is often put at the end of a stage to mark the completion of a work package or phase. Milestones can be put before the end of a phase so that corrective actions can be taken, if problems arise, and the deliverable can be completed on time.
In addition to signaling the completion of a key deliverable, a milestone may also signify an important decision or the derivation of a critical piece of information, which outlines or affects the future of a project. In this sense, a milestone not only signifies distance traveled (key stages in a project) but also indicates direction of travel since key decisions made at milestones may alter the route through the project plan." [Milestone (project management). Wikipedia]
This timeline diagram example was created using the ConceptDraw PRO diagramming and vector drawing software extended with the Timeline Diagrams solution from the Management area of ConceptDraw Solution Park.
Timeline

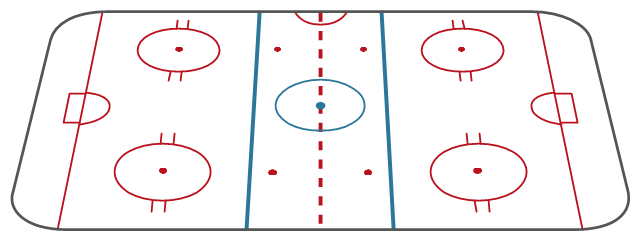
"Markings.
Lines.
The centre line divides the ice in half crosswise. It is used to judge icing, meaning that if a team sends the puck across the centre line (red line), blue line and then across the goal line (that is to say, shoots or dumps the puck past the goal line from behind their own side of the centre line) it is said to be icing. ...
Faceoff spots and circles.
There are 9 faceoff spots on a hockey rink. Most faceoffs take place at these spots. There are two spots in each end zone, two at each end of the neutral zone, and one in the centre of the rink.
There are faceoff circles around the centre ice and end zone faceoff spots. There are hash marks painted on the ice near the end zone faceoff spots. The circles and hash marks show where players may legally position themselves during a faceoff or in game play. ...
Spot and circle dimensions.
Both the center faceoff spot and center faceoff circle are blue. The spot is a solid blue circle 12 inches (30 cm) in diameter. Within the spot is a center, a circle 30 feet (9.1 m) in diameter, painted with a blue line 2 inches (5.1 cm) in width.
All of the other faceoff spots have outlines 2 inches (5.1 cm) thick, forming a circle 2 feet (0.61 m) in diameter measured from the outsides of the outlines, and are filled in with red in all areas except for the 3 inches (7.6 cm) space from the tops and bottoms of the circles, measured from the insides of the outline. ...
Goal posts and nets.
At each end of the ice, there is a goal consisting of a metal goal frame and cloth net in which each team must place the puck to earn points. According to NHL and IIHF rules, the entire puck must cross the entire goal line in order to be counted as a goal. ...
Goal area.
The crease is a special area of the ice designed to allow the goaltender to perform without interference. In most leagues, goals are disallowed if an attacking player enters the goal crease with a stick, skate, or any body part before the puck. For the purposes of this rule, the crease extends vertically from the painted lines to the top of the goal frame. ...
Goaltender trapezoid.
During the 2004-05 American Hockey League (AHL) season, an experimental rule was implemented for the first seven weeks of the season, instituting a goaltender trap zone, more commonly called the trapezoid in reference to its shape. Under the rule, it is prohibited for the goaltender to handle the puck anywhere behind the goal line that is not within the trapezoidal area. If they do so they are assessed a minor penalty for delay of game. ...
Referee's crease.
The referee's crease is a semicircle ten feet in radius in front of the scorekeepers bench." [Ice hockey rink. Wikipedia]
The diagram template "Ice hockey rink view from long side" for the ConceptDraw PRO diagramming and vector drawing software is included in the Hockey solution from the Sport area of ConceptDraw Solution Park.
Ice hockey rink diagram template
 Computer Network Diagrams
Computer Network Diagrams solution extends ConceptDraw PRO software with samples, templates and libraries of vector icons and objects of computer network devices and network components to help you create professional-looking Computer Network Diagrams, to plan simple home networks and complex computer network configurations for large buildings, to represent their schemes in a comprehensible graphical view, to document computer networks configurations, to depict the interactions between network's components, the used protocols and topologies, to represent physical and logical network structures, to compare visually different topologies and to depict their combinations, to represent in details the network structure with help of schemes, to study and analyze the network configurations, to communicate effectively to engineers, stakeholders and end-users, to track network working and troubleshoot, if necessary.
Soccer (Football) Field Templates
 Field")
Marketing - Design Elements

Cisco Routers. Cisco icons, shapes, stencils and symbols
 Router subdued Router-with-silicon-switch Wavelength-router NetFlow-router uBR910 Broadband-router Gigabit-switch-ATM-tag-router ATM-tag-switch-router Edge-label-switch-router Edge-label-switch-router-with-NetFlow Cisco-7505 Cisco-7507 Cisco-7500-ARS-(7513) Voice-enabled-router TDM-router IP-telephony-router IAD-router Content-service-router Cisco-storage-router Router-with-firewall Wireless-router ASR-1000-series ATM-3800 AXP Cable-modem Ground-terminal. Network equipment refers to hardware devices designed for local area networks, both wired and wireless. Active network equipment is powered from the electricity supply, portable battery, the computer via USB-port and other sources, also it can be used for amplification, conversion and processing of the network signal.")
"In association football, the formation describes how the players in a team are positioned on the pitch. Different formations can be used depending on whether a team wishes to play more attacking or defensive football. ...
The 4–3–3 was a development of the 4–2–4, and was played by the Brazilian national team in the 1962 World Cup. The extra player in midfield allows a stronger defence, and the midfield could be staggered for different effects. The three midfielders normally play closely together to protect the defence, and move laterally across the field as a coordinated unit. The three forwards split across the field to spread the attack, and may be expected to mark the opposition full-backs as opposed to doubling back to assist their own full-backs, as do the wide midfielders in a 4–4–2. When used from the start of a game, this formation is widely regarded as encouraging expansive play, and should not be confused with the practice of modifying a 4–4–2 by bringing on an extra forward to replace a midfield player when behind in the latter stages of a game. This formation is suited for a short passing game and useful for ball retention.
A staggered 4–3–3 involving a defensive midfielder (usually numbered four or six) and two attacking midfielders (numbered eight and ten) was commonplace in Italy, Argentina, and Uruguay during the 1960s and 1970s. The Italian variety of 4–3–3 was simply a modification of WM, by converting one of the two wing-halves to a libero (sweeper), whereas the Argentine and Uruguayan formations were derived from 2–3–5 and retained the notional attacking centre-half. The national team which made this famous was the Dutch team of the 1974 and 1978 World Cups, even though the team won neither." [Formation (association football). Wikipedia]
The diagram example "Association football (soccer) formation 4-3-3" was created using the ConceptDraw PRO diagramming and vector drawing software extended with the Football solution from the Sport area of ConceptDraw Solution Park.
www.conceptdraw.com/ solution-park/ sport-soccer
Association football (soccer) formation diagram
-formation-diagram-association-football-(soccer)-formation-4-3-3.png--diagram-flowchart-example.png)
- Block Diagram For Sunglass
- How To Create a Workflow Diagram | Use Case Diagrams ...
- Target Diagram | ConceptDraw Solution Park | UML Diagram Editor ...
- ERD Symbols and Meanings | Network Diagram Software LAN ...
- Marketing - Vector stencils library | Entity Relationship Diagram ...
- Content Marketing Infographics | Marketing Analysis Diagram ...
- Glyph icons - Vector stencils library | UML State Machine Diagram ...
- Marketing - Vector stencils library | How to Build Cloud Computing ...
- Design elements - Android buttons | UML Class Diagram . Design ...
- Data flow diagram (DFD) - Payment for goods using UPS code ...
- UML Sequence Diagram . Design Elements | Glyph icons - Vector ...
- Marketing - Vector stencils library | Rack Diagrams | With The Aid Of ...
- Road Mark Icon Black Pictogram
- UML Use Case Diagram . Design Elements | Glyph icons - Vector ...
- Target market | Circle Spoke Diagram Template | Target and ...
- How to Add a Block Diagram to a PowerPoint Presentation Using ...
- Radar Chart | Chart Software for Better Presentations | Diagram of a ...
- Target market | Circle Spoke Diagram Template | Target and ...
- Football field diagram | Soccer (Football) Field Templates | Soccer ...