 Chemistry
This solution extends ConceptDraw PRO software with samples, template and libraries of vector stencils for drawing the Chemistry Illustrations for science and education.
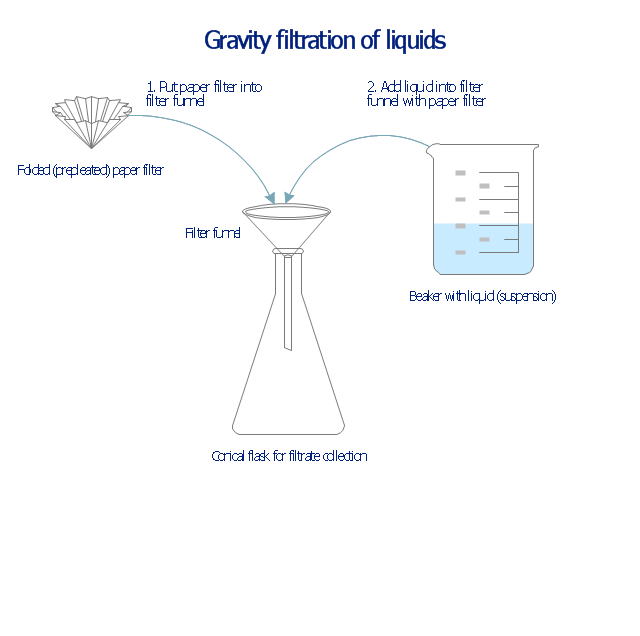
This chemical laboratory technique drawing depict gravity filtration of liquid through prepleated paper filter step-by-step.
1. Put folded filter paper cone into glass filter funnel inserted into neck of conical (Erlenmeyer) flask.
2. Add liquid suspension from the glass beaker with a spout into the funnel with paper filter.
3. Collect filtrate in the conical flask and solid on the paper filter in the funnel.
"Filtration is commonly the mechanical or physical operation which is used for the separation of solids from fluids (liquids or gases) by interposing a medium through which only the fluid can pass. The fluid that pass through is called a filtrate. Oversize solids in the fluid are retained, but the separation is not complete; solids will be contaminated with some fluid and filtrate will contain fine particles (depending on the pore size and filter thickness)." [Filtration. Wikipedia]
"Filter paper is a semi-permeable paper barrier placed perpendicular to a liquid or air flow. It is used to separate fine solids from liquids or air." [Filter paper. Wikipedia]
The chemical lab drawing example "Gravity filtration of liquids" was created using the ConceptDraw PRO diagramming and vector drawing software extended with the Chemistry solution from the Science and Education area of ConceptDraw Solution Park.
Liquid filtration through filter paper
Chemistry Symbols and Meanings

Types of Flowcharts


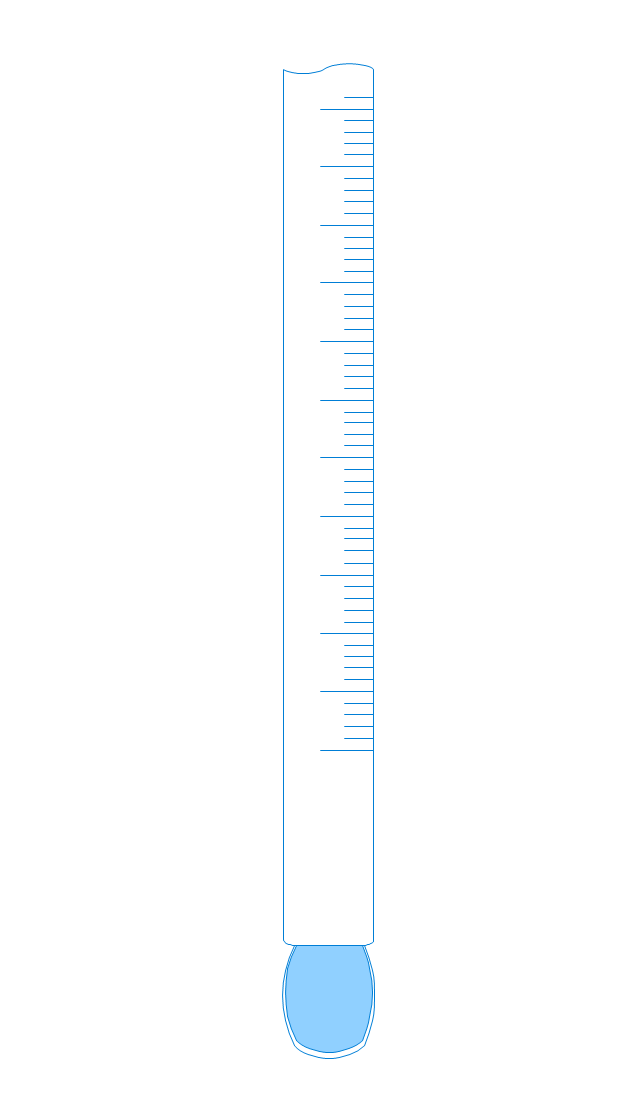
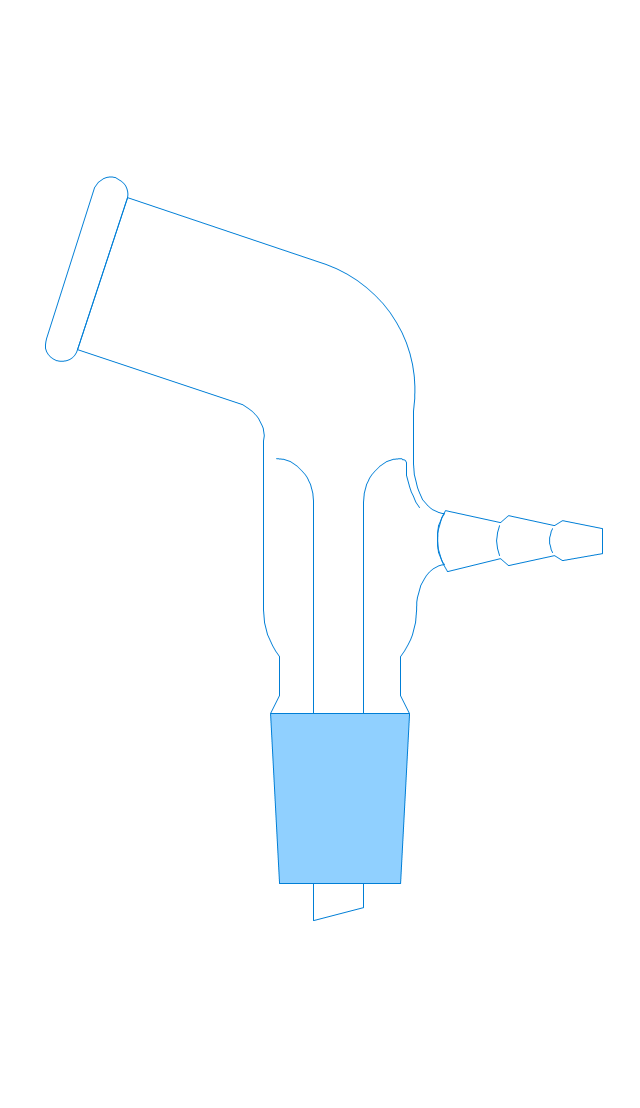
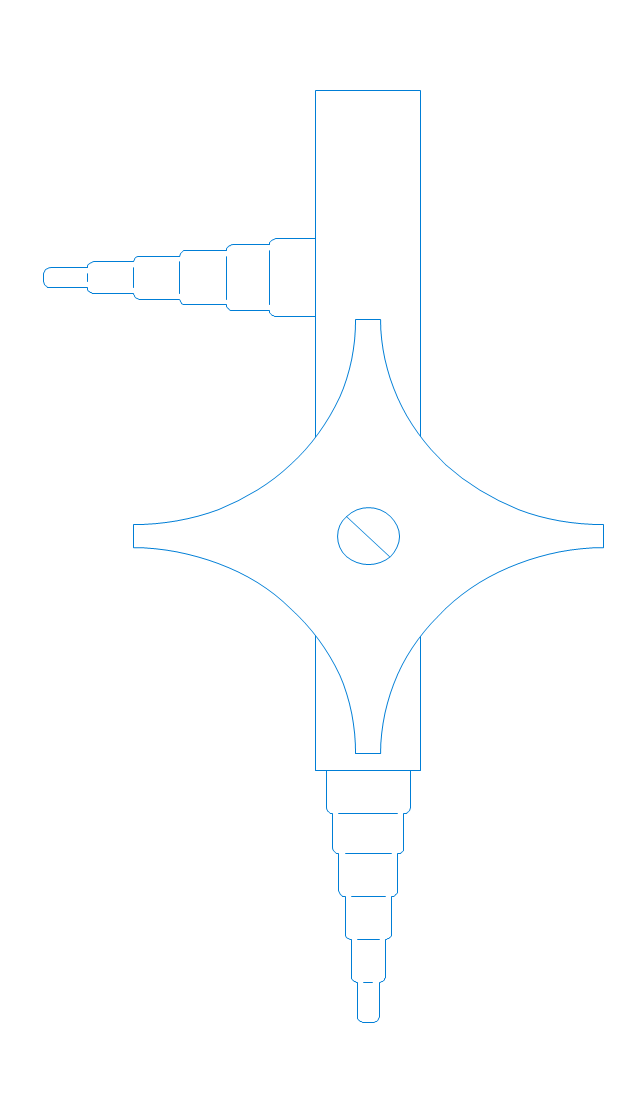
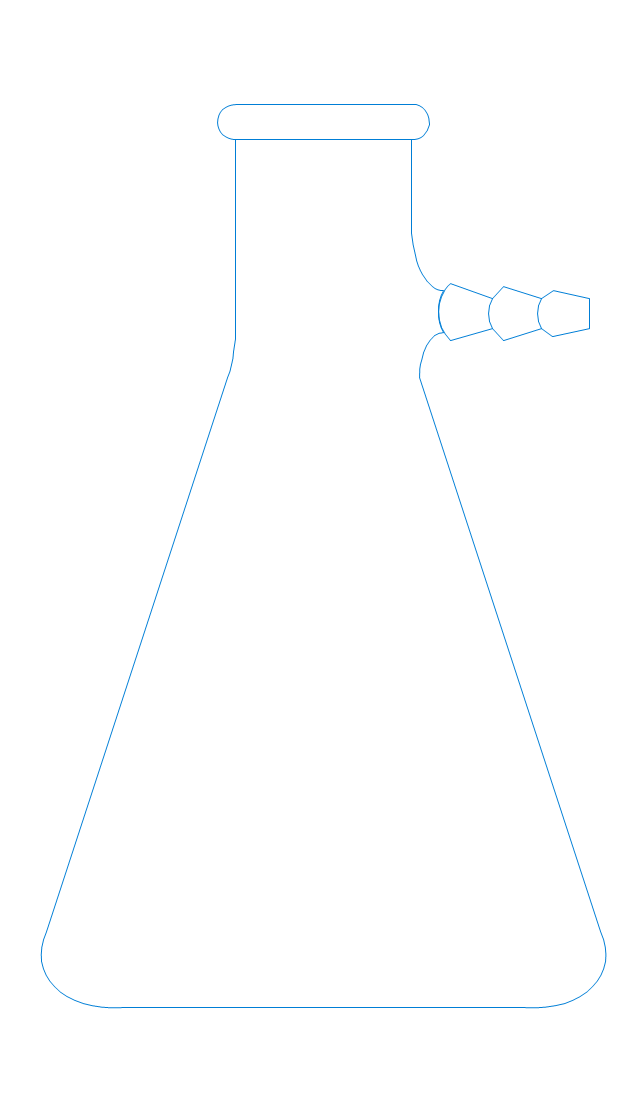
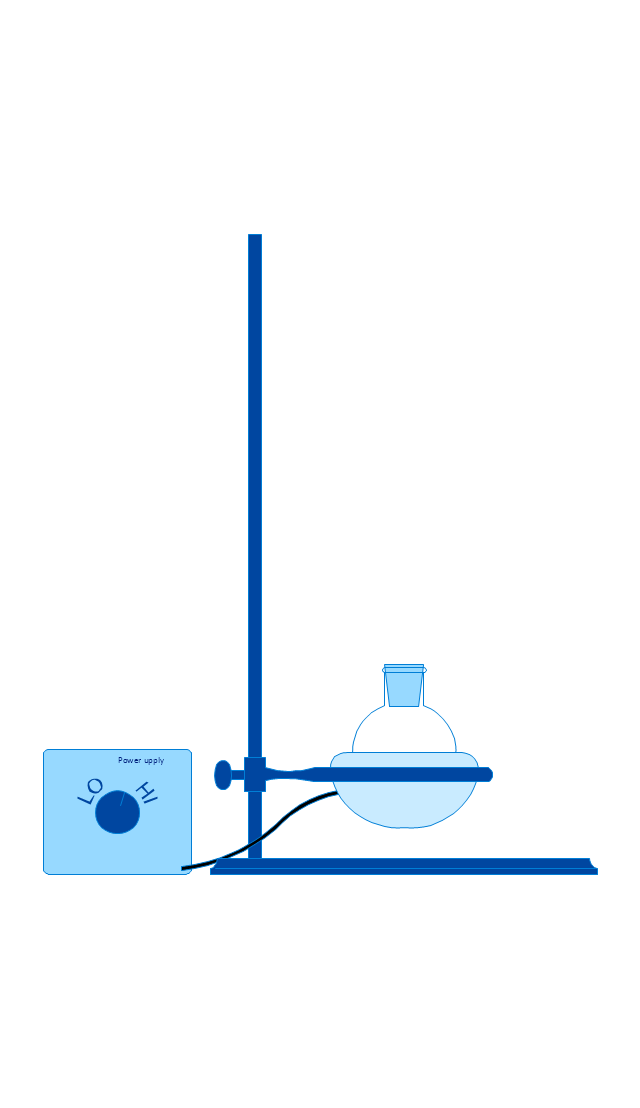
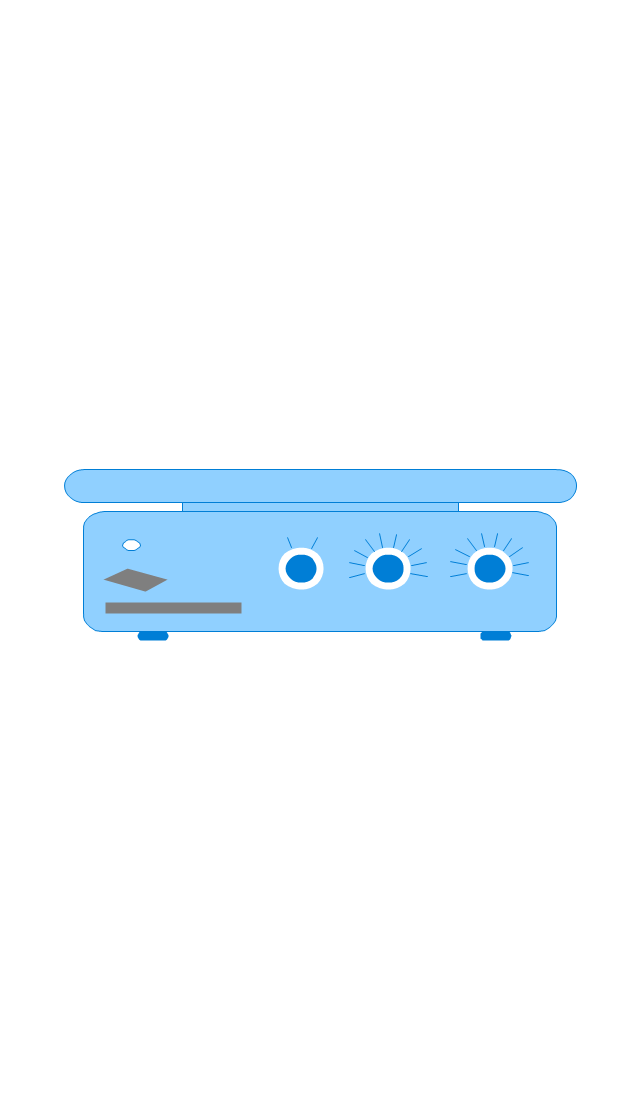
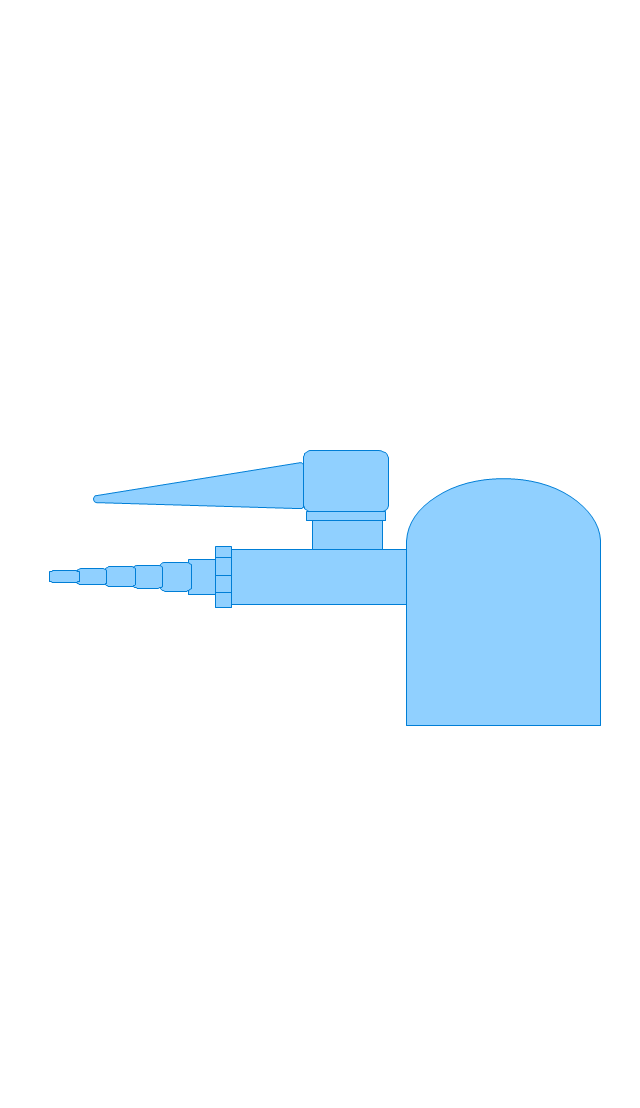
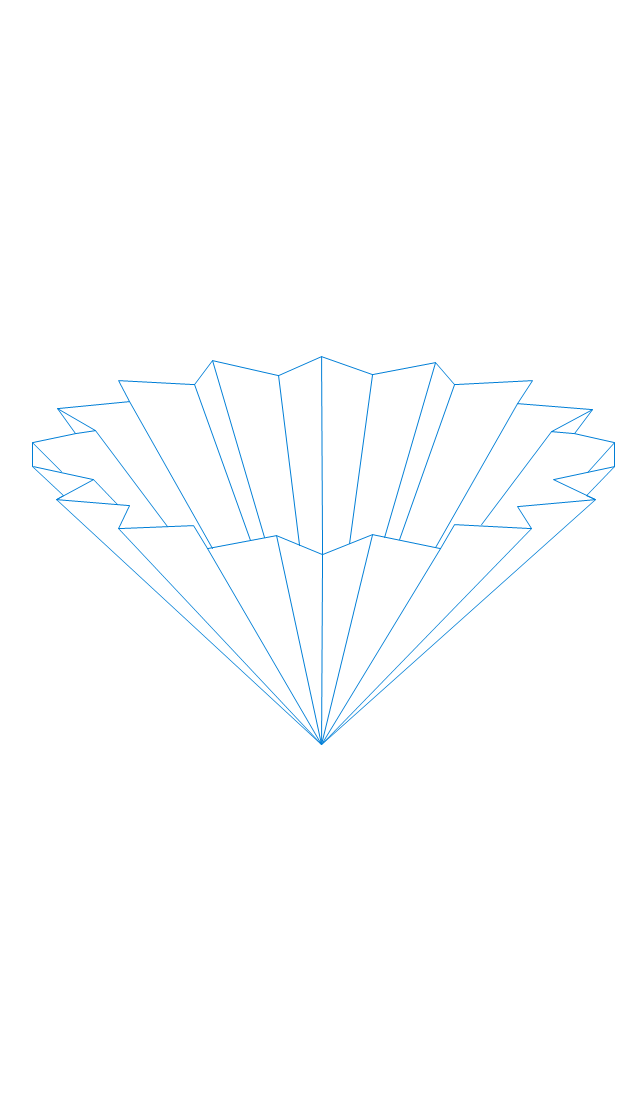
The vector stencils library "Laboratory equipment" contains 31 clipart icons of chemical laboratory equipment and labware.
Use these shapes for drawing part assembly and mounting schemes of glassware apparatus in chemical experiment diagrams and illustrations in the ConceptDraw PRO diagramming and vector drawing software extended with the Chemistry solution from the Science and Education area of ConceptDraw Solution Park.
Use these shapes for drawing part assembly and mounting schemes of glassware apparatus in chemical experiment diagrams and illustrations in the ConceptDraw PRO diagramming and vector drawing software extended with the Chemistry solution from the Science and Education area of ConceptDraw Solution Park.
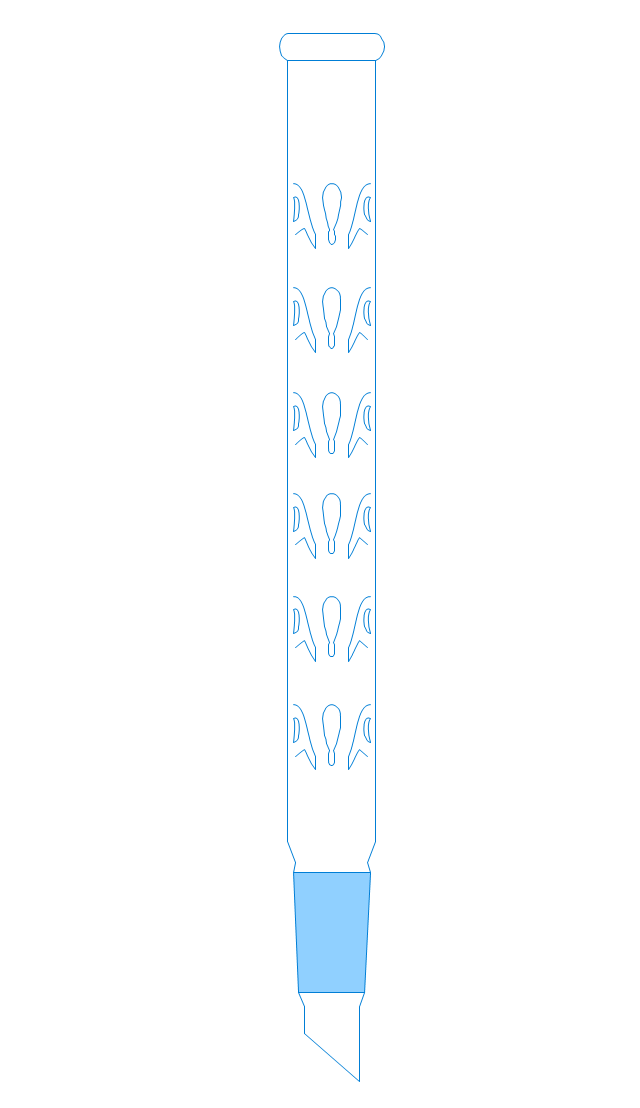
Vigreux distillation column
Hirsch funnel
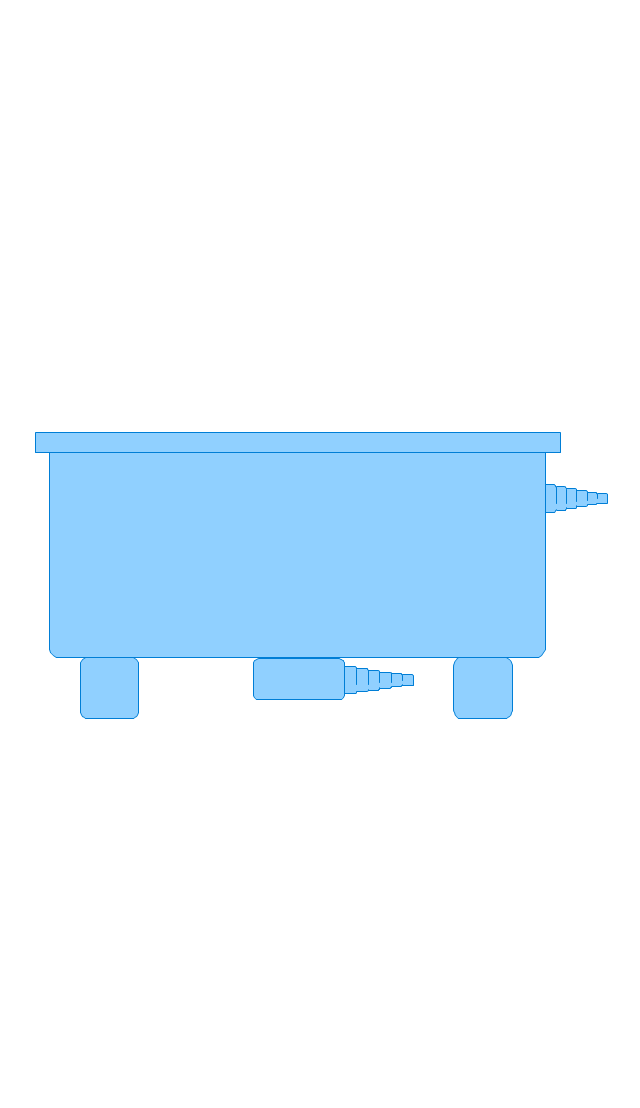
Oil bath

Steam bath
Thermometer
Tap (valve)
--laboratory-equipment---vector-stencils-library.png--diagram-flowchart-example.png)
Vacuum adaptor
Liebig condenser (long)
-laboratory-equipment---vector-stencils-library.png--diagram-flowchart-example.png)
Liebig condenser (short)
-laboratory-equipment---vector-stencils-library.png--diagram-flowchart-example.png)
Water faucet
Büchner flask
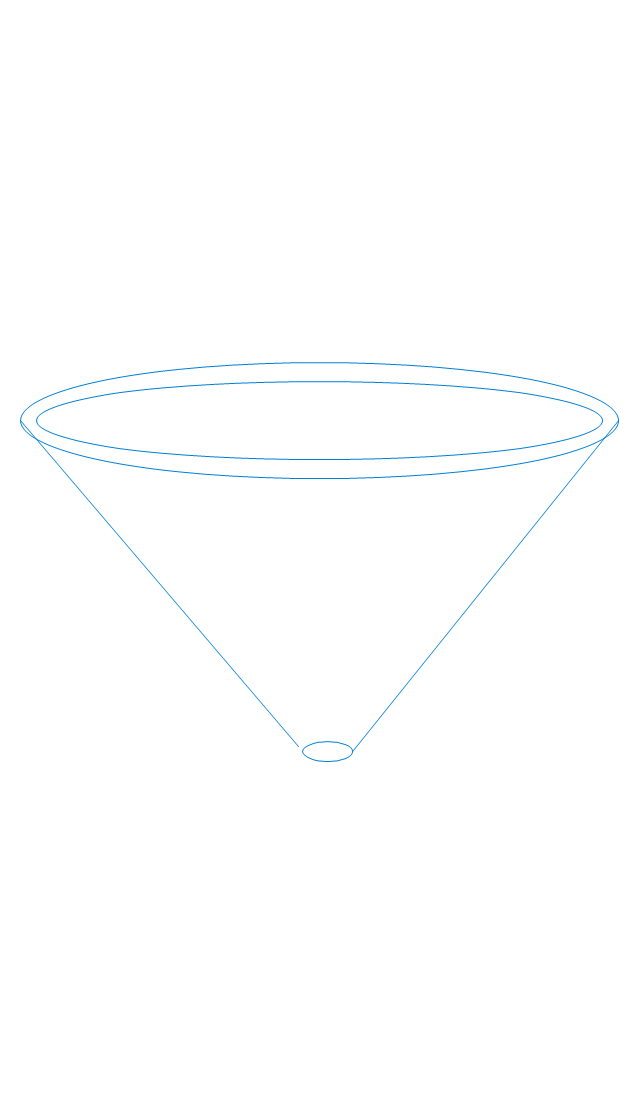
Stemless funnel
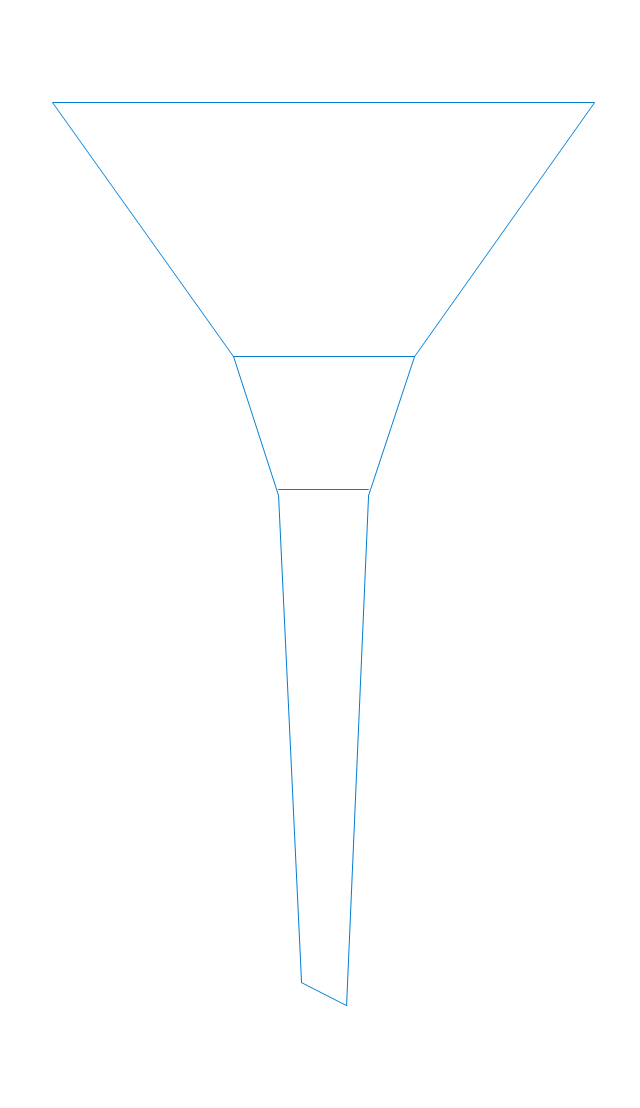
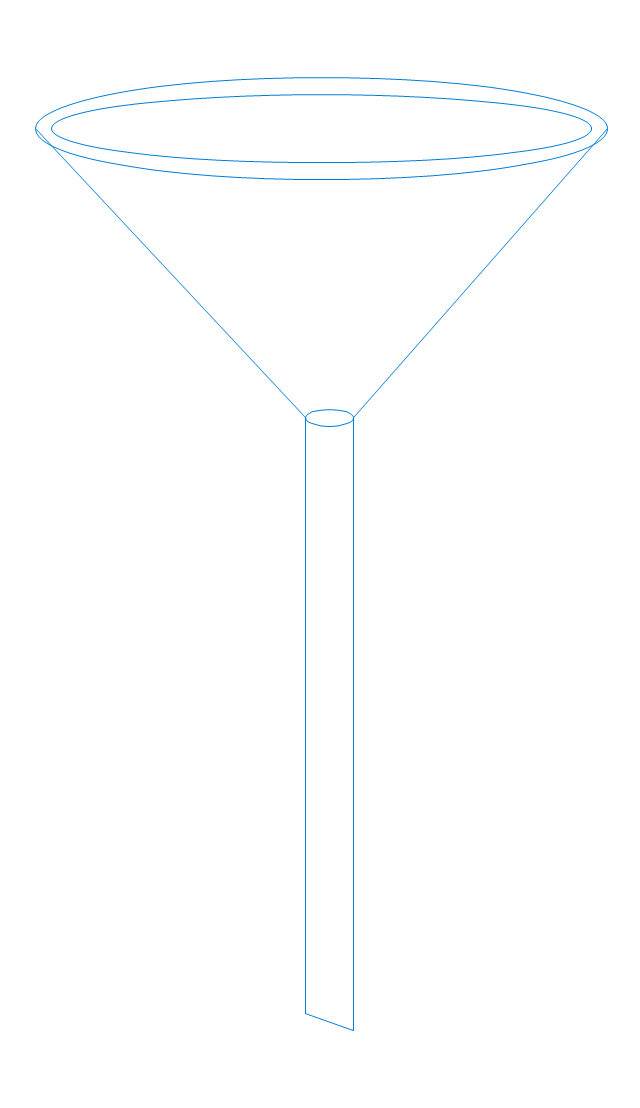
Stemmed funnel
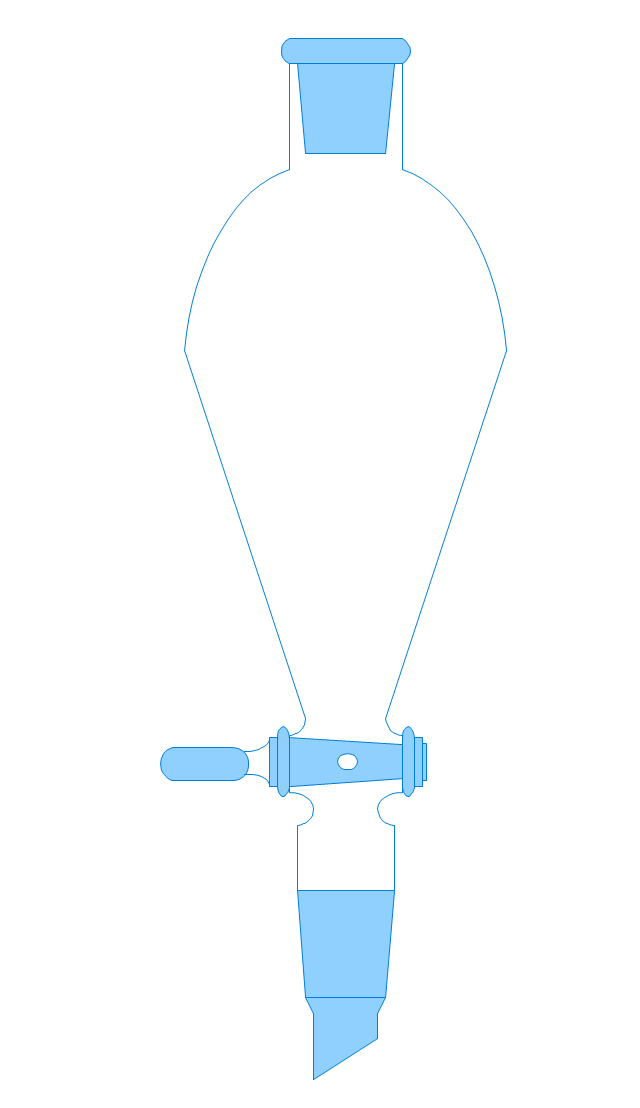
Separatory funnel
Heating mantle
Hot plate
Gas tap
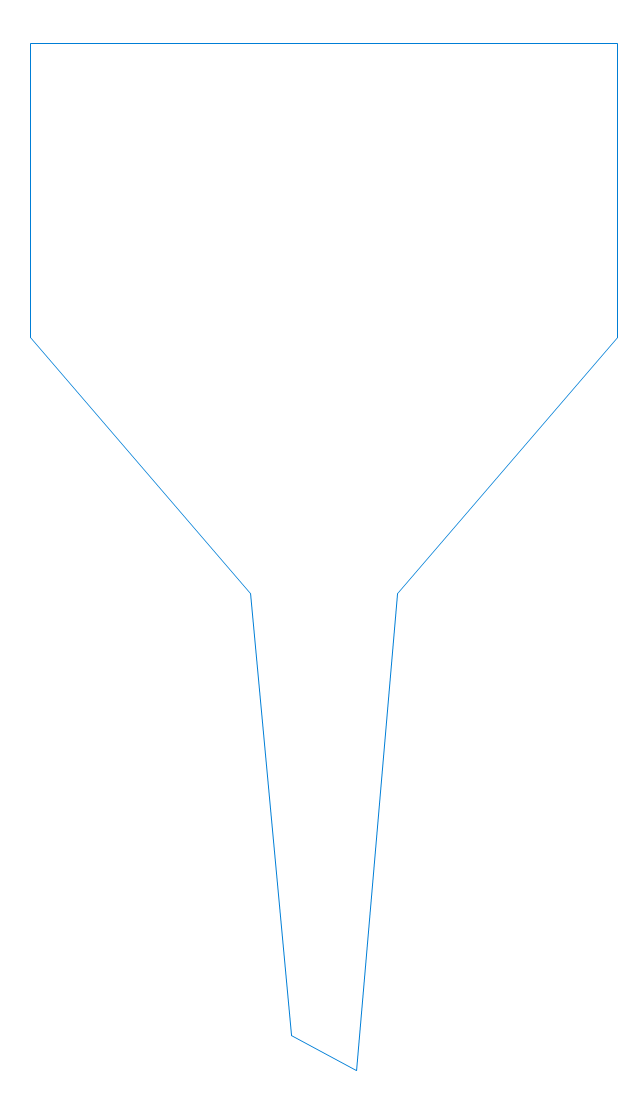
Folded filter paper
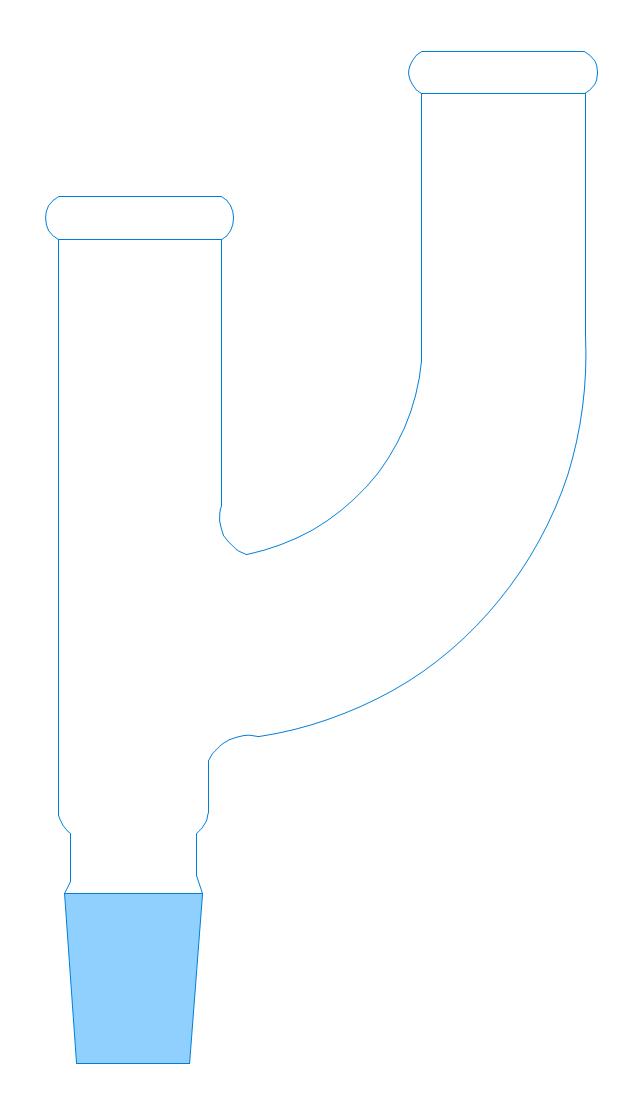
Y-Adaptor
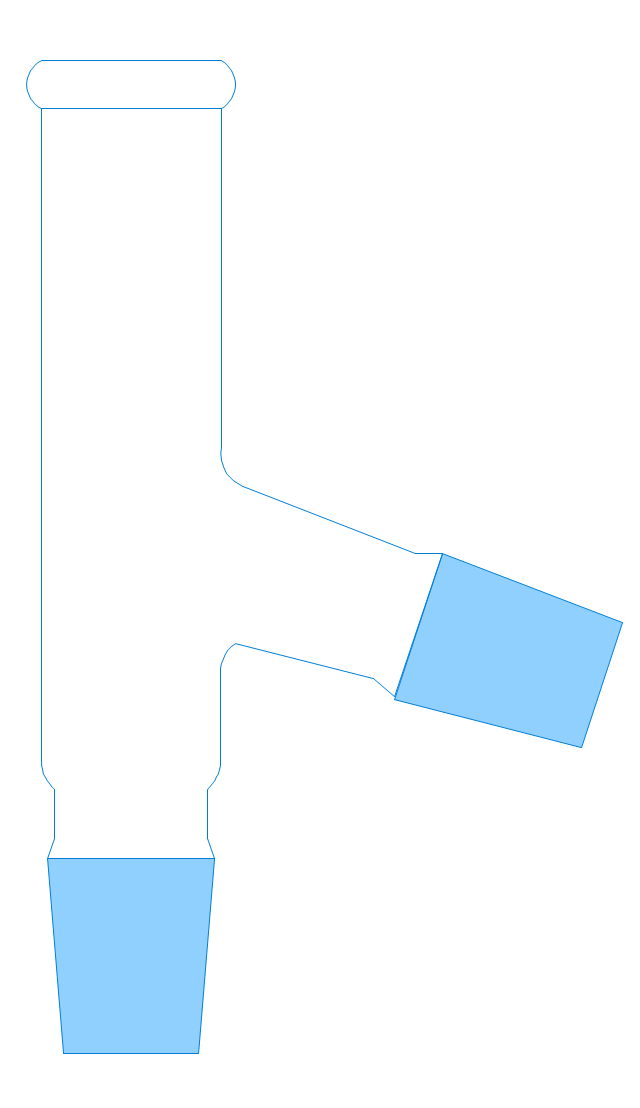
Claisen adapter
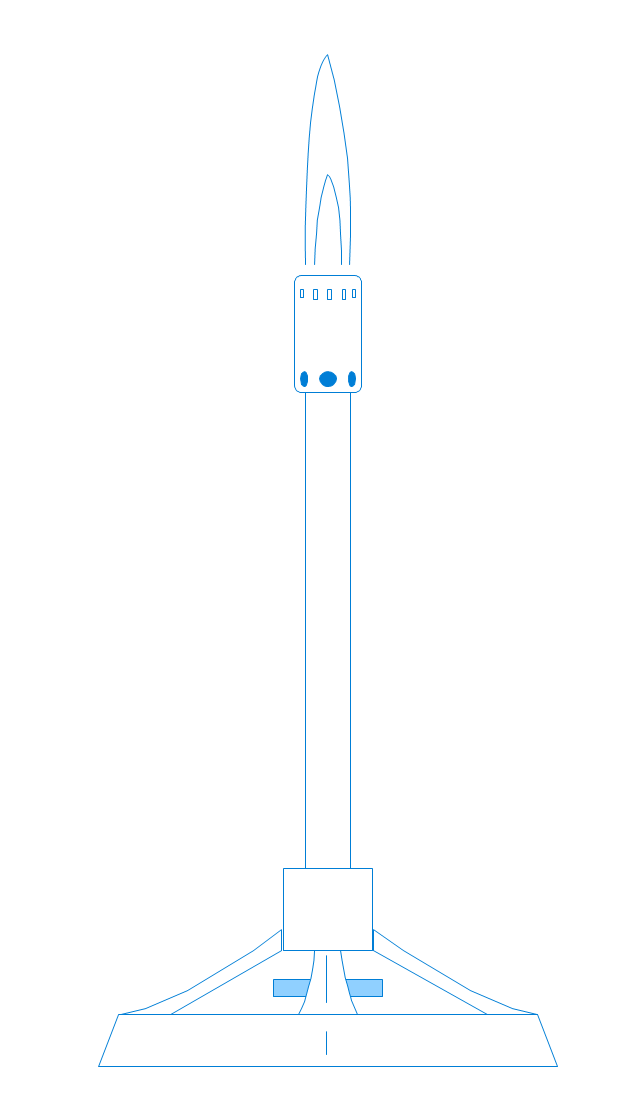
Bunsen burner
Büchner funnel
Erlenmeyer flask, 25ml
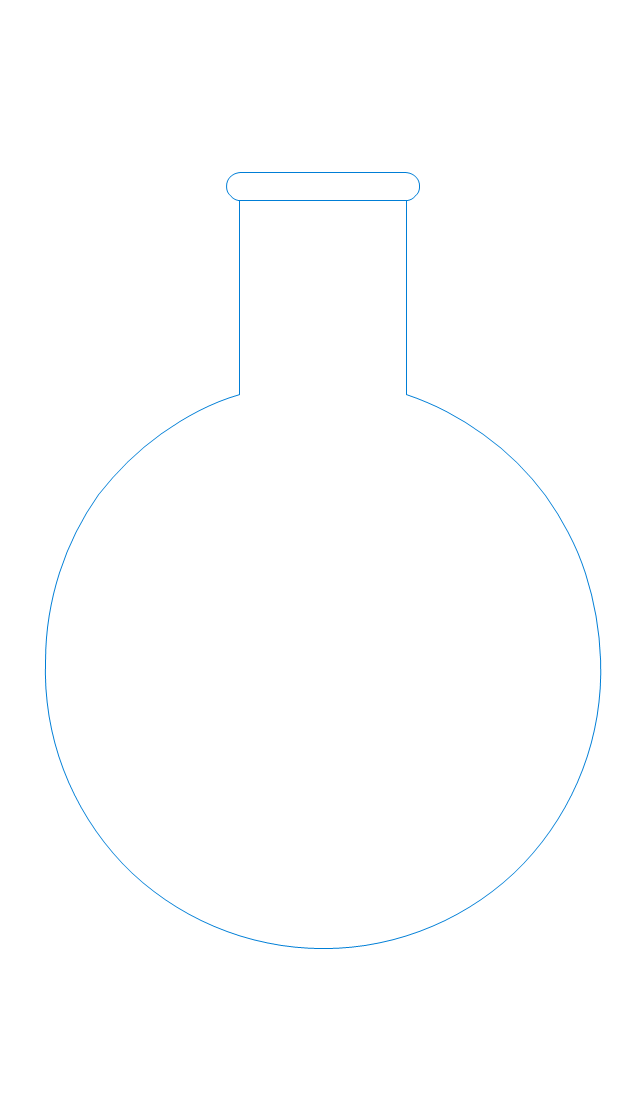
Round-bottom flask, 50ml
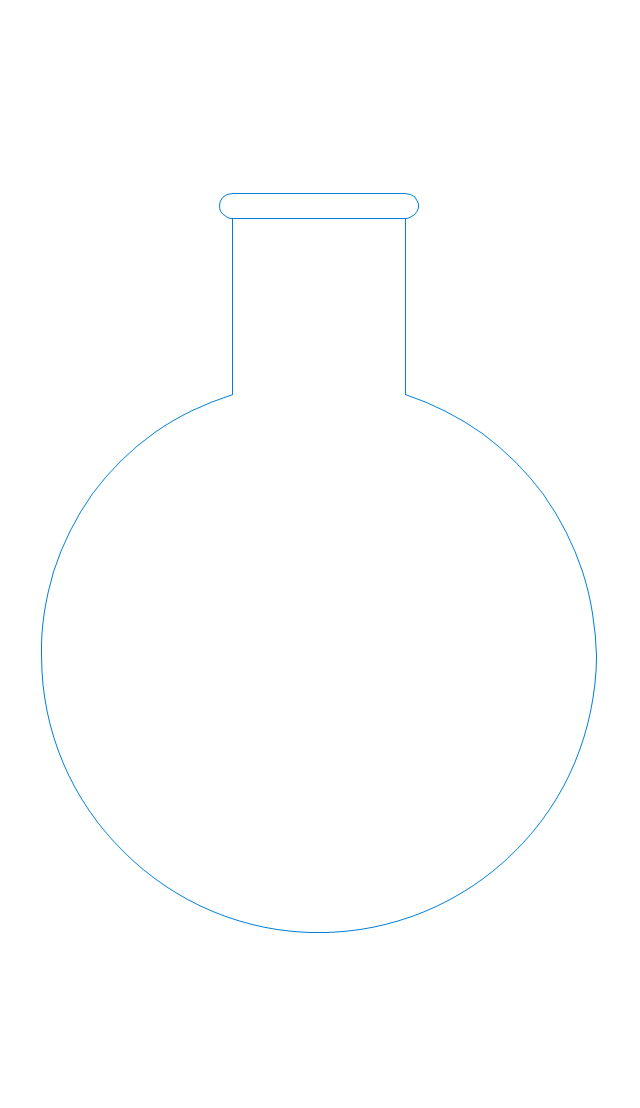
Round-bottom flask, 250ml
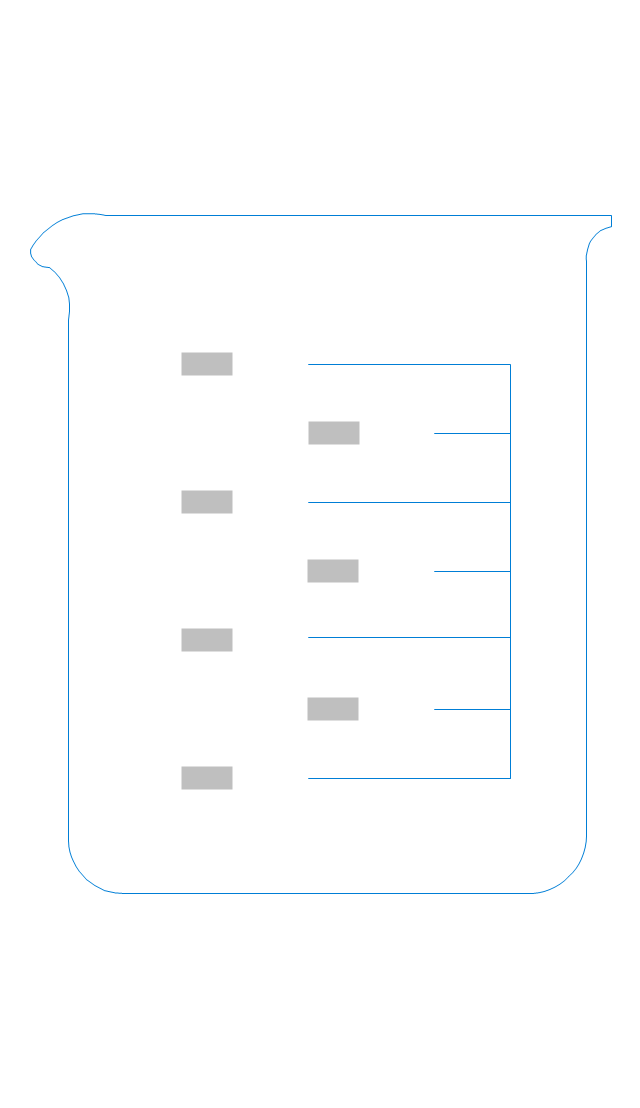
Beaker 100ml, filled
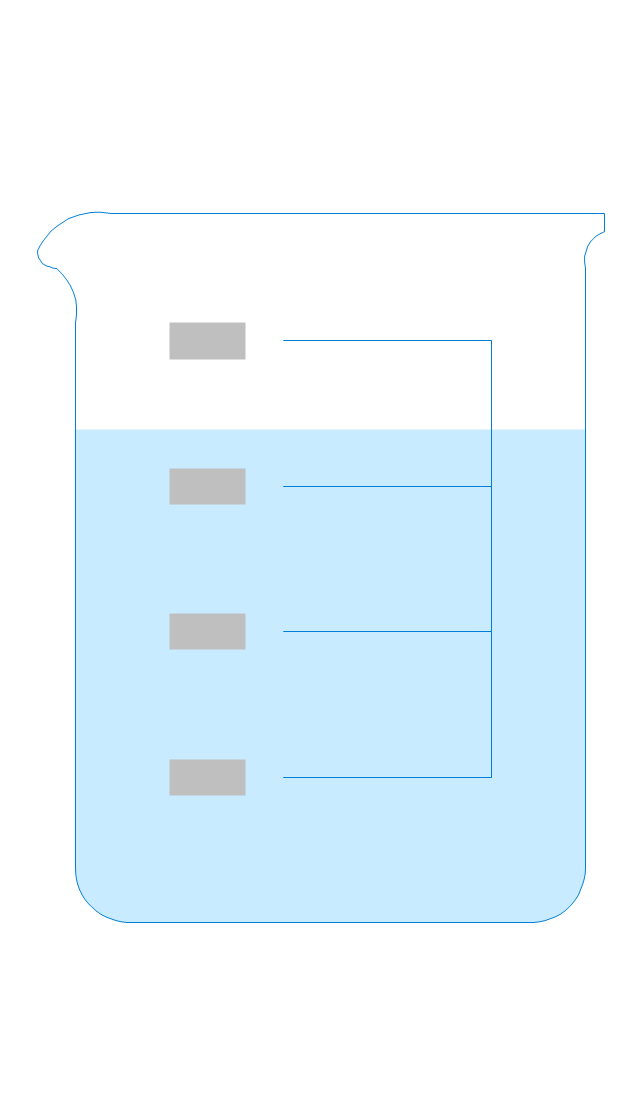
Beaker 100ml, empty

Beaker 500ml, filled
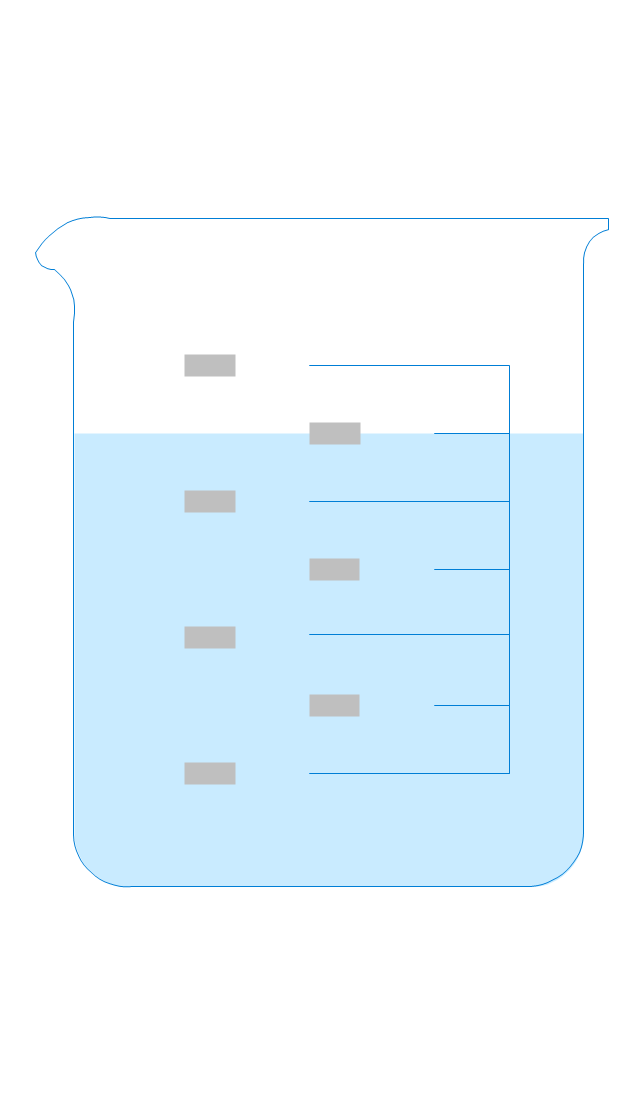
Beaker 500ml, empty
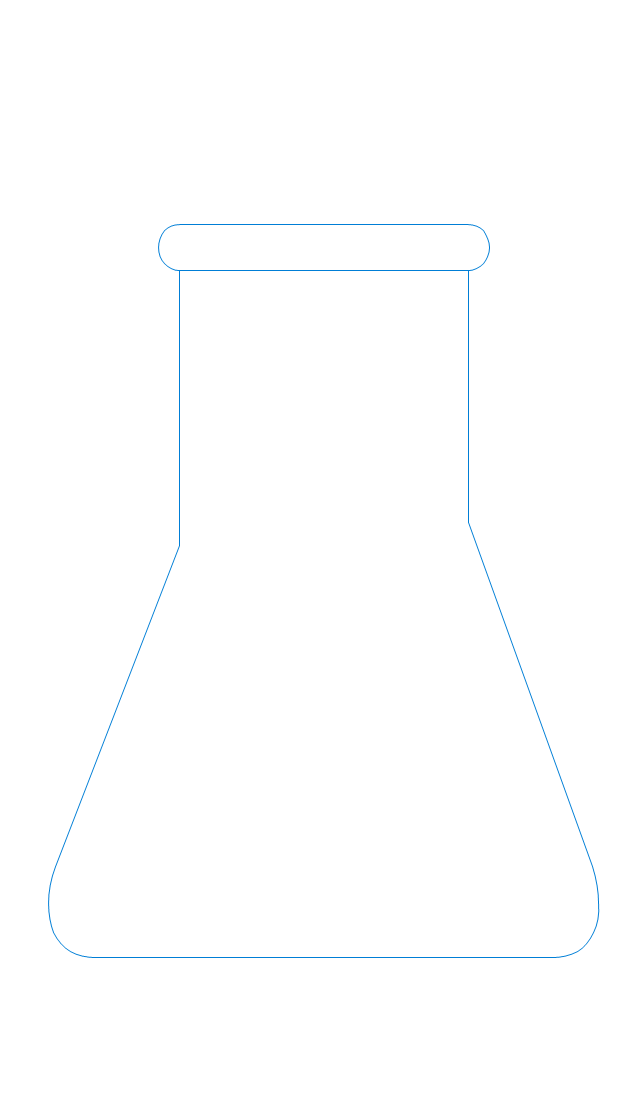
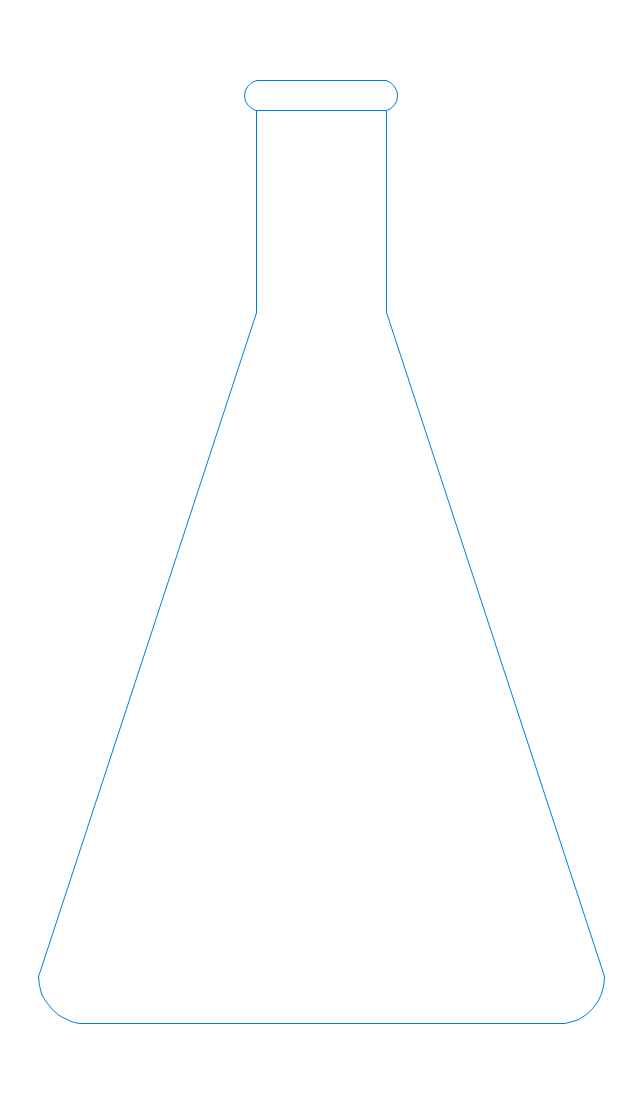
Erlenmeyer flask 250ml, filled
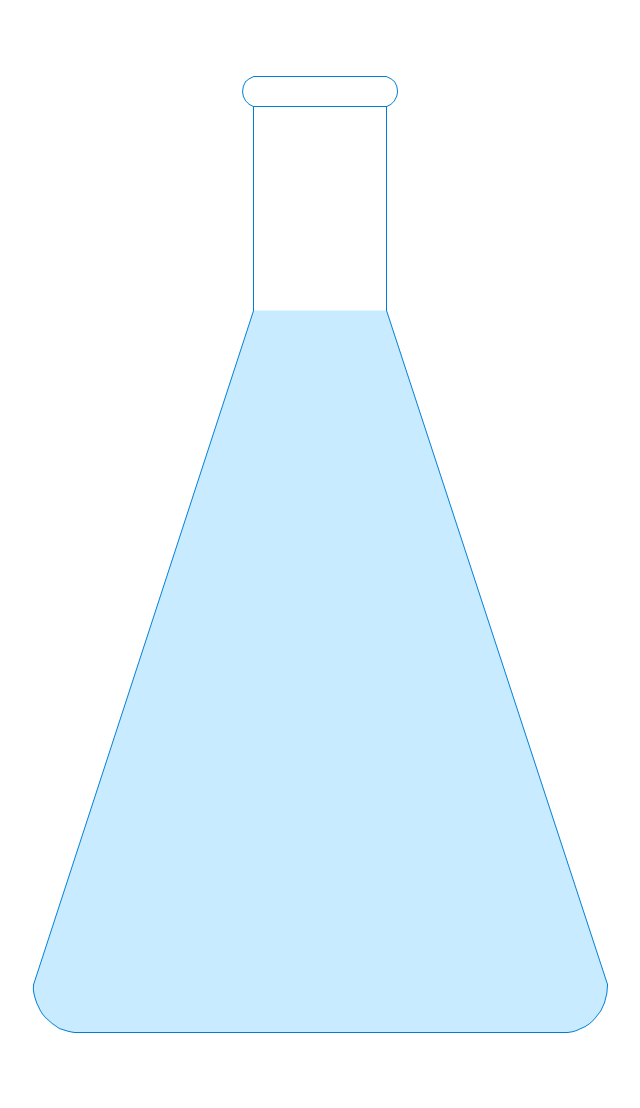
Erlenmeyer flask 250ml, empty
Local area network (LAN). Computer and Network Examples
. Computer and Network Examples")

Electrical Symbols — VHF UHF SHF

Cross-Functional Flowchart


Electrical Symbols, Electrical Diagram Symbols

Process Flow Diagram Symbols

Work Order Process Flowchart. Business Process Mapping Examples

In searching of alternative to MS Visio for MAC and PC with ConceptDraw PRO

Electrical Drawing Software and Electrical Symbols

 Cross-Functional Flowcharts
Cross-functional flowcharts are powerful and useful tool for visualizing and analyzing complex business processes which requires involvement of multiple people, teams or even departments. They let clearly represent a sequence of the process steps, the order of operations, relationships between processes and responsible functional units (such as departments or positions).
 Chemical and Process Engineering
This chemical engineering solution extends ConceptDraw PRO v.9.5 (or later) with process flow diagram symbols, samples, process diagrams templates and libraries of design elements for creating process and instrumentation diagrams, block flow diagrams (BFD
- Diagram Filtration Through Filter Paper
- Gravity filtration of liquids | Diagram Of Gravity Filtration Techniques
- Filter Paper Chemistry Clipart
- Diagram Of A Lab Filter Funnel
- Laboratory equipment - Vector stencils library | Gravity filtration of ...
- Gravity filtration of liquids | Water cycle diagram | Design elements ...
- Laboratory equipment - Vector stencils library | Gravity filtration of ...
- Gravity filtration of liquids | Diagrams Of Separation Technique
- Gravity filtration of liquids | Glassware In Science Labs
- Gravity filtration of liquids | Fold Filter Paper Wikipedia
- Gravity filtration of liquids | Physics Diagrams | Chemistry Lab Name ...
- Diagram Of Gravity
- Draw Filter Paper
- Laboratory equipment - Vector stencils library | Pyramid Diagram ...
- Diagram Of Laboratory Equipments And Their Uses
- Bar Diagrams for Problem Solving. Create space science bar charts ...
- Filter Paper Definition Chemistry
- Glassware Equipment In Chemistry Lab With Their Use And Diagram
- Gravity filtration of liquids | How to Create a Custom Filter in ...
- Diagrams Of Glassware Equipments