Simple Flow Chart

 Chemistry
This solution extends ConceptDraw DIAGRAM software with samples, template and libraries of vector stencils for drawing the Chemistry Illustrations for science and education.
 Physics
Physics solution extends ConceptDraw DIAGRAM software with templates, samples and libraries of vector stencils for drawing the physical illustrations, diagrams and charts.
Chemistry Symbols and Meanings
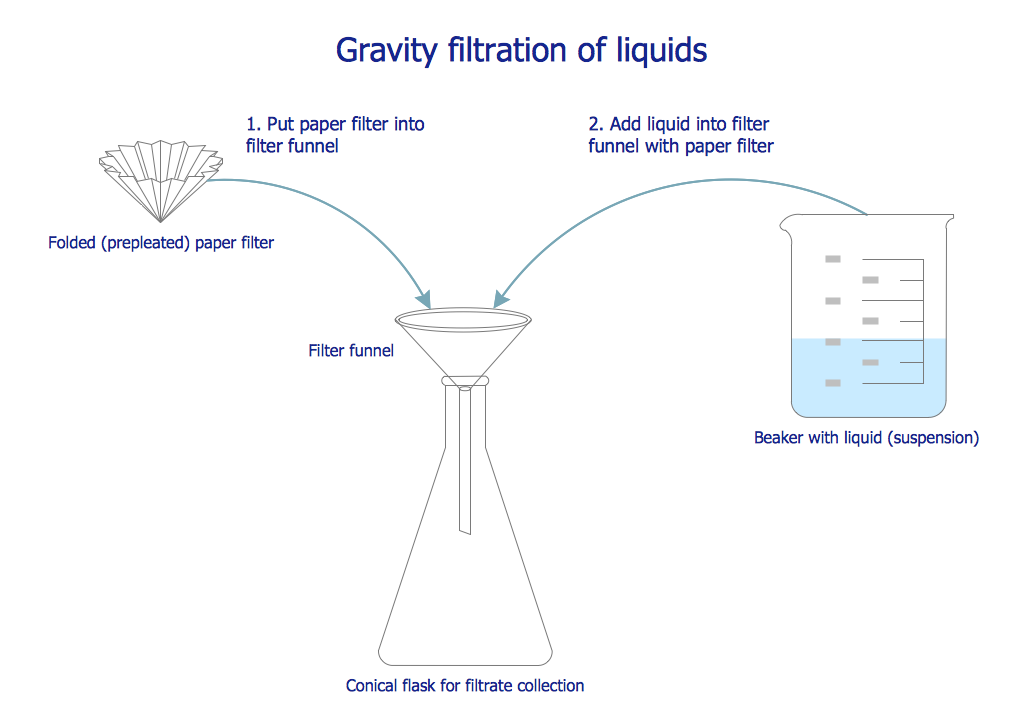
This chemical laboratory technique drawing depict gravity filtration of liquid through prepleated paper filter step-by-step.
1. Put folded filter paper cone into glass filter funnel inserted into neck of conical (Erlenmeyer) flask.
2. Add liquid suspension from the glass beaker with a spout into the funnel with paper filter.
3. Collect filtrate in the conical flask and solid on the paper filter in the funnel.
"Filtration is commonly the mechanical or physical operation which is used for the separation of solids from fluids (liquids or gases) by interposing a medium through which only the fluid can pass. The fluid that pass through is called a filtrate. Oversize solids in the fluid are retained, but the separation is not complete; solids will be contaminated with some fluid and filtrate will contain fine particles (depending on the pore size and filter thickness)." [Filtration. Wikipedia]
"Filter paper is a semi-permeable paper barrier placed perpendicular to a liquid or air flow. It is used to separate fine solids from liquids or air." [Filter paper. Wikipedia]
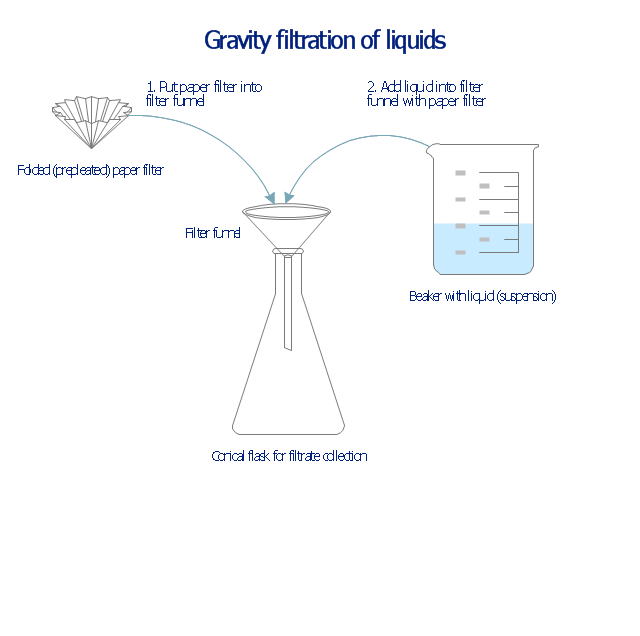
The chemical lab drawing example "Gravity filtration of liquids" was created using the ConceptDraw PRO diagramming and vector drawing software extended with the Chemistry solution from the Science and Education area of ConceptDraw Solution Park.
1. Put folded filter paper cone into glass filter funnel inserted into neck of conical (Erlenmeyer) flask.
2. Add liquid suspension from the glass beaker with a spout into the funnel with paper filter.
3. Collect filtrate in the conical flask and solid on the paper filter in the funnel.
"Filtration is commonly the mechanical or physical operation which is used for the separation of solids from fluids (liquids or gases) by interposing a medium through which only the fluid can pass. The fluid that pass through is called a filtrate. Oversize solids in the fluid are retained, but the separation is not complete; solids will be contaminated with some fluid and filtrate will contain fine particles (depending on the pore size and filter thickness)." [Filtration. Wikipedia]
"Filter paper is a semi-permeable paper barrier placed perpendicular to a liquid or air flow. It is used to separate fine solids from liquids or air." [Filter paper. Wikipedia]
The chemical lab drawing example "Gravity filtration of liquids" was created using the ConceptDraw PRO diagramming and vector drawing software extended with the Chemistry solution from the Science and Education area of ConceptDraw Solution Park.
Liquid filtration through filter paper
 IDEF Business Process Diagrams
Use the IDEF Business Process Diagrams solution to create effective database designs and object-oriented designs, following the integration definition methodology.
 AWS Architecture Diagrams
AWS Architecture Diagrams with powerful drawing tools and numerous predesigned Amazon icons and AWS simple icons is the best for creation the AWS Architecture Diagrams, describing the use of Amazon Web Services or Amazon Cloud Services, their application for development and implementation the systems running on the AWS infrastructure. The multifarious samples give you the good understanding of AWS platform, its structure, services, resources and features, wide opportunities, advantages and benefits from their use; solution’s templates are essential and helpful when designing, description and implementing the AWS infrastructure-based systems. Use them in technical documentation, advertising and marketing materials, in specifications, presentation slides, whitepapers, datasheets, posters, etc.
Venn Diagram Examples for Problem Solving. Computer Science. Chomsky Hierarchy

 Specification and Description Language (SDL)
For people in the field of systems engineering or system design, working with specification and description language (sdl) and finite state machines (fsm).
 Australia Map
For graphic artists creating accurate maps of Australia. The Australia Map solution - allows designers to map Australia for their needs, offers a collection of scalable graphics representing the political geography of Australia, split into distinct state
- Gravity filtration of liquids | Diagram Of Gravity Filtration Techniques
- Drawca Labelled Diagram Of Gravity Filtration Technique
- Gravity filtration of liquids | Embedded Filtering Capabilities in ...
- Draw A Labelled Diagram Of Gravity Filtration Techniques
- Diagram Of Gravity Filtration Technique
- Draw A Well Labelled Diagram Of Gravity Filtration Technique
- Chemistry Symbols and Meanings | Chemistry | Gravity filtration of ...
- Chemistry | Gravity filtration of liquids | How to Use Mind Map ...
- Simple Flow Chart | Physics Diagrams | Chemistry | Gravity Related ...