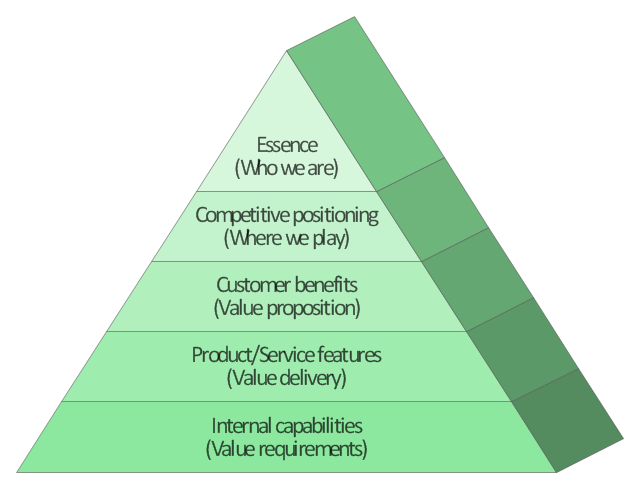
This market value pyramid diagram has 5 levels:
1) Essence (Who we are),
2) Competitive positioning (Where we play),
3) Customer benefits (Value proposition),
4) Product / Service features (Value delivery),
5) Internal capabilitiea (Value requirements).
Use this triangular scheme to develop your marketing strategy.
"Market value or OMV (Open Market Valuation) is the price at which an asset would trade in a competitive auction setting. Market value is often used interchangeably with open market value, fair value or fair market value, although these terms have distinct definitions in different standards, and may differ in some circumstances." [Market value. Wikipedia]
The triangle chart example "Market value" was created using the ConceptDraw PRO diagramming and vector drawing software extended with the Pyramid Diagrams solution from the Marketing area of ConceptDraw Solution Park.
Pyramid diagram
Pyramid Diagram and Pyramid Chart

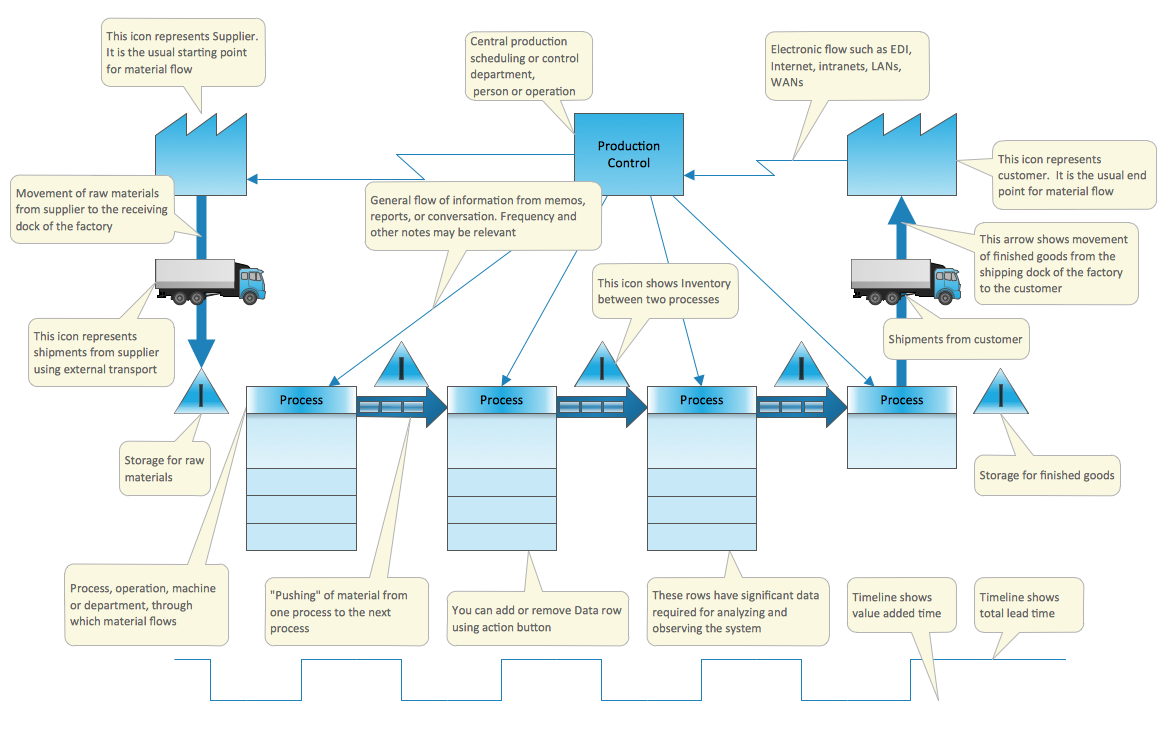
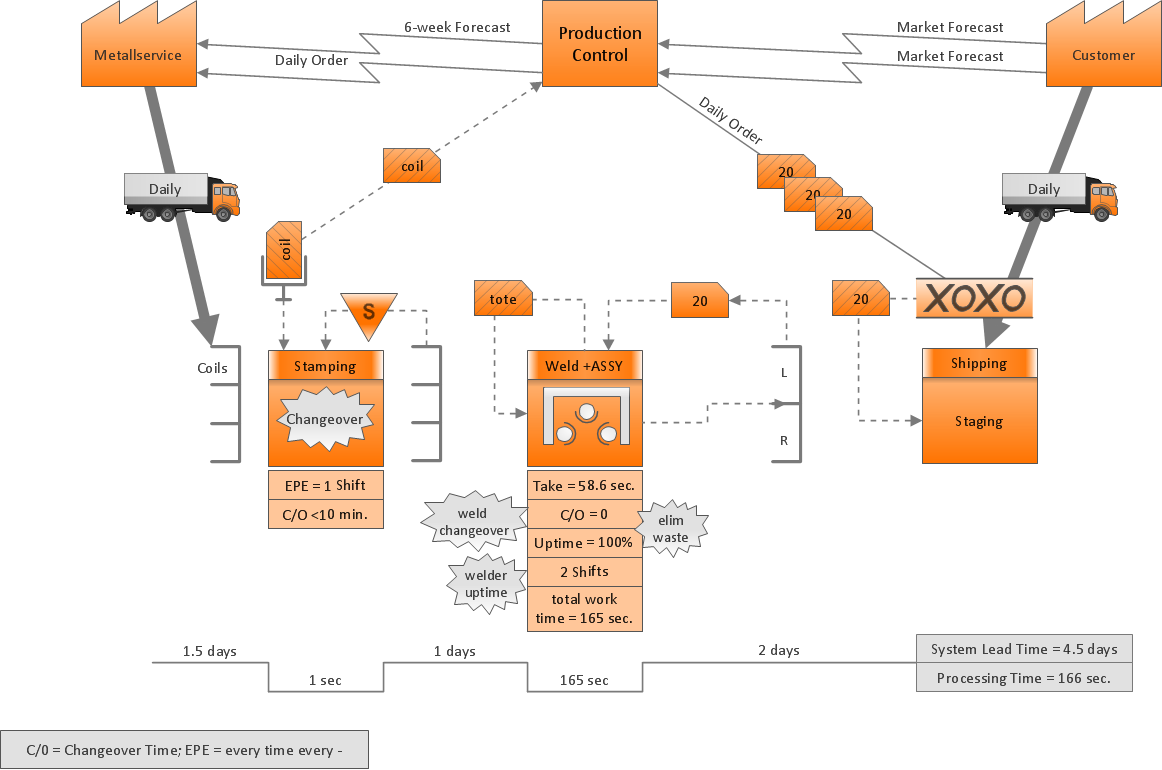
Value Stream Mapping Template
Pyramid Charts

Pyramid Chart Examples

 Pyramid Diagrams
Pyramid Diagrams solution extends ConceptDraw DIAGRAM software with templates, samples and library of vector stencils for drawing the marketing pyramid diagrams.
Competitor Analysis

How to Create a Pyramid Diagram

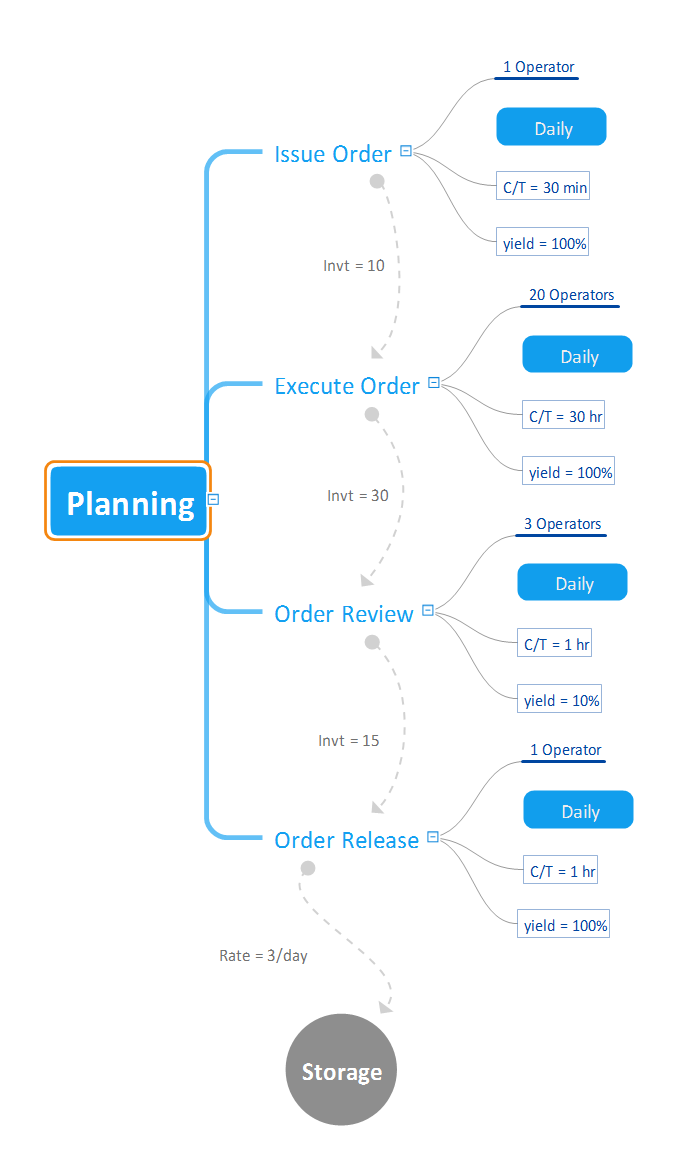
Value Stream Map
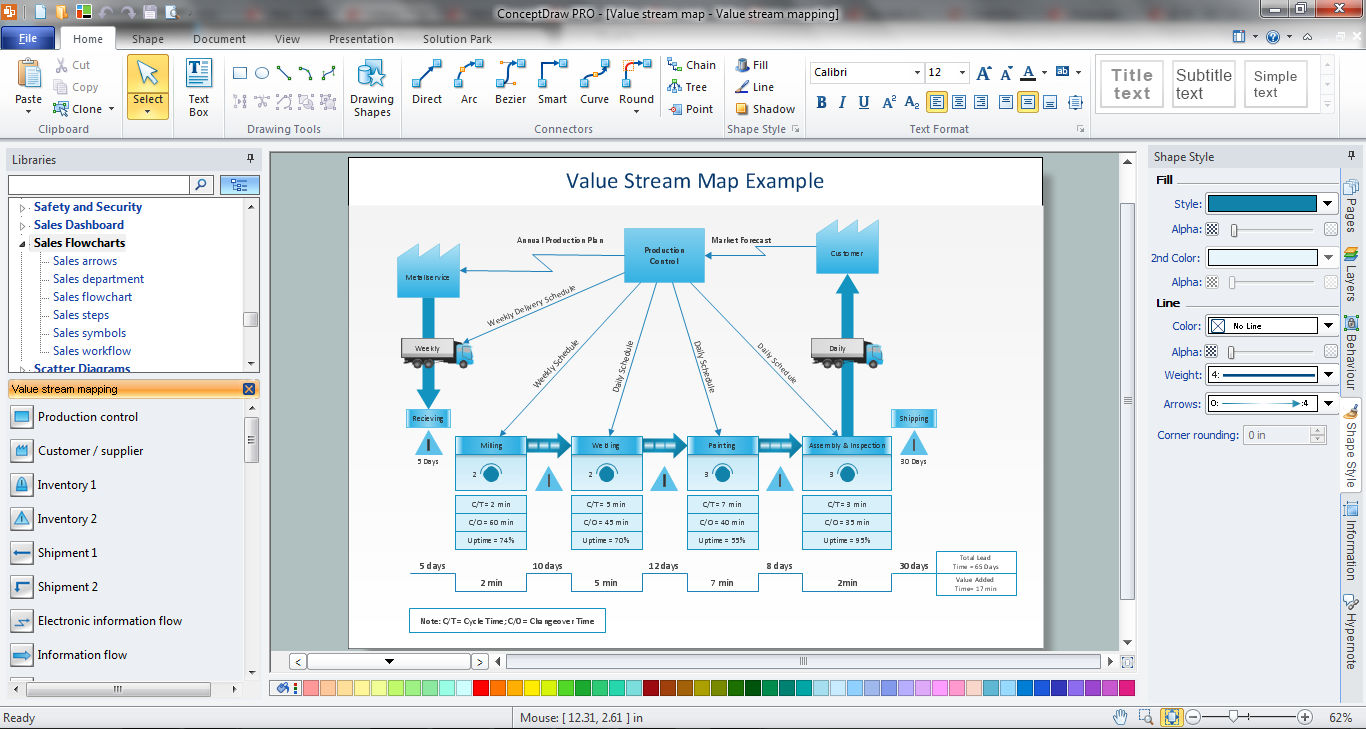
Value Stream Mapping Software
Six Markets Model Chart Template

 Value Stream Mapping
Value stream mapping solution extends ConceptDraw DIAGRAM software with templates, samples and vector stencils for drawing the Value Stream Maps (VSM) in lean manufacturing practice.
Value Stream Mapping for the Lean Office
Pyramid Chart Maker

Flowchart Symbols Accounting. Activity-based costing (ABC) flowchart

- Customer Value Proposition Example
- Marketing Pyramid
- Market And Customer Value With Diagram S
- Market value - Pyramid diagram
- Market value - Pyramid diagram | Target market - Onion diagram ...
- Customer Loyalty Pyramid
- Market value - Pyramid diagram
- Customer Value Diagram
- Diagram Of Customer Market
- Six Markets Model Chart | Target market - Onion diagram | Marketing ...
- Marketing Analysis Diagram | Flowchart Marketing Process ...
- Marketing Analysis Diagram | Competitor Analysis | Social strategy ...
- Competitor Analysis | Total Quality Management Value | Matrices ...
- Pyramid Diagram and Pyramid Chart | Pyramid Charts | 6-Level 3D ...
- Target Diagram | Target market - Onion diagram | Target and ...
- Customer Decision Making Diagram Example
- Marketing Analysis Diagram | Marketing Diagrams | Cloud marketing ...
- Marketing Analysis Diagram | Marketing Flow Chart | Marketing ...
- Decision Making | Pyramid Diagram | Workflow Diagram | Decision ...