HelpDesk
How To Create a CRM System Dashboard

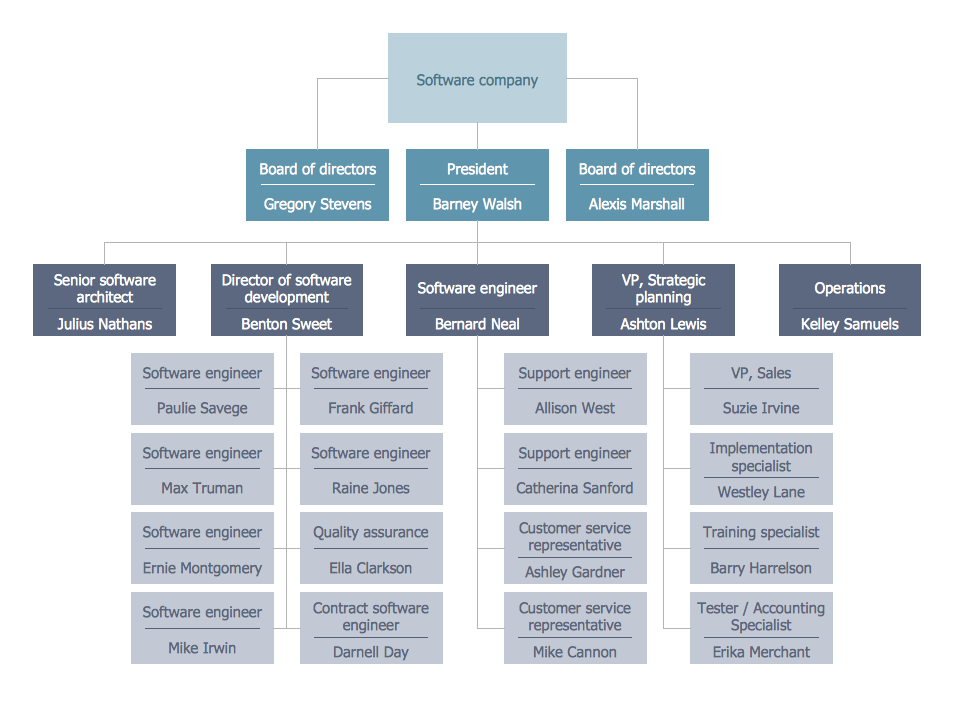
Marketing and Sales Organization chart. Organization chart Example

 CRM Center Dashboard
The CRM Center Dashboard solution extends ConceptDraw DIAGRAM functionality with CRM software tools, large collection of CRM Charts live objects, CRM icons, CRM indicators, CRM maps and navigation elements, the set of professionally designed CRM samples and templates to help you construct your own CRM Dashboards and CRM Center Dashboards in a few minutes, to depict the current and actual data by connecting or refreshing the data source file. The customer management software ConceptDraw DIAGRAM makes you free to choose the style for your dashboard and to regulate the quantity of clipart on the diagram according to your taste.
Influence Diagram

Flowchart Example: Flow Chart of Marketing Analysis

 Plan-Do-Check-Act (PDCA)
Plan-Do-Check-Act (PDCA) solution extends the ConceptDraw DIAGRAM software with collection of samples and predesigned vector objects for easy visualization four stages of PDCA cycle, PDSA cycle, or Deming cycle, for illustration effective application of this method to the practical business tasks, for depiction the implementation of changes and solution the problems in business processes. Plan-Do-Check-Act (PDCA) solution helps to design professional-looking and attractive Plan Do Study Act diagrams, PDCA cycle diagrams, PDCA Process diagrams, and to construct the Quality Management Process Models, which all assist to manage efficiently the business processes, to improve quality of work and to reduce significantly the costs.
Sales Process Management

It is effective to use professional software for the sales process management. ConceptDraw DIAGRAM diagramming and vector drawing software extended with Sales Flowcharts solution from the Marketing area of ConceptDraw Solution Park is the best choice.
Business Structure
How to Use the ″Online Store PR Campaign″ Sample

- Network Diagram Examples | Interactive Voice Response Diagrams ...
- How to Draw a Computer Network Diagrams | Process Flowchart ...
- Process Flowcharts | Process Flowchart | Network Diagram Software ...
- PDPC | Fault Tree Analysis Diagrams | Process Flowchart | Free ...
- Fault Tree Analysis Excel Template
- Call center network diagram | Design Element: IVR for Network ...
- Example of DFD for Online Store (Data Flow Diagram ) | Customer ...
- Basic Flowchart Symbols and Meaning | Diagramming tool ...
- Network Diagram Software IVR Services | Basic Flowchart Symbols ...
- Flow Chart Of Service Sector