Basic Flowchart Symbols and Meaning


Diagramming tool - Amazon Web Services and Cloud Computing Diagrams

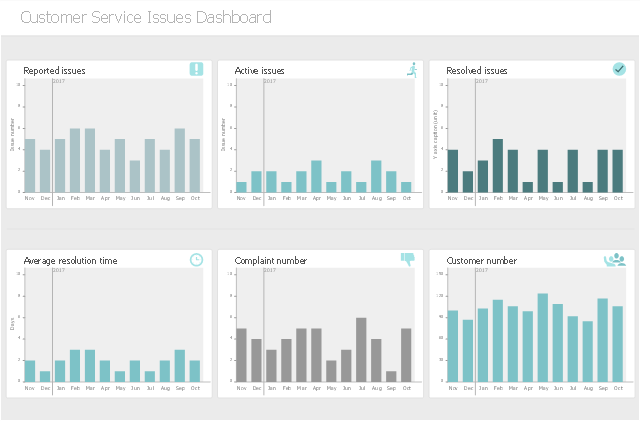
This customer relationship management dashboard sample represents business metric and KPI dynamics using column charts.
"Customer service is the provision of service to customers before, during and after a purchase. ... Customer service concerns the priority an organization assigns to customer service relative to components such as product innovation and pricing. In this sense, an organization that values good customer service may spend more money in training employees than the average organization or may proactively interview customers for feedback." [Customer service. Wikipedia]
The CRM dashboard example "Customer Service Issues Dashboard" was designed using ConceptDraw PRO software extended with CRM Center Dashboard solution from Management area of ConceptDraw Solution Park.
Business dashboard
AWS Simple Icons for Architecture Diagrams

Process Flowchart


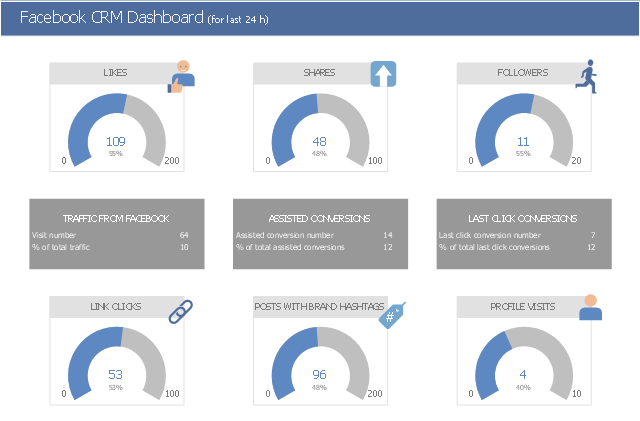
This social media customer service dashboard sample visualizes CRM business metrics and KPIs using graphic indicators.
"Social CRM (customer relationship management) is use of social media services, techniques and technology to enable organizations to engage with their customers. ...
Social CRM has applications in marketing, customer service and sales, including:
* Social Engagement with prospects...
* Social Customer Service...
* Personalized Marketing Strategy" [Social CRM. Wikipedia]
The social CRM dashboard example "Facebook CRM Dashboard" was designed using ConceptDraw PRO software extended with CRM Center Dashboard solution from Management area of ConceptDraw Solution Park.
Business dashboard
Value Stream Mapping Icons
 Logistic Dashboard
The powerful tools of Logistic Dashboard solution and specially developed live graphic objects of logistic icons, logistic navigation elements, logistic indicators, logistic charts and logistic maps effectively assist in designing Logistic dashboards, Logistic maps, Logistic charts, diagrams and infographics. The included set of prebuilt samples and quick-start templates, demonstrates the power of ConceptDraw PRO software in logistics management, its assisting abilities in development, realization and analyzing the logistic processes, as well as in perfection the methods of logistics management.
AWS

 Cross-Functional Flowcharts
Cross-functional flowcharts are powerful and useful tool for visualizing and analyzing complex business processes which requires involvement of multiple people, teams or even departments. They let clearly represent a sequence of the process steps, the order of operations, relationships between processes and responsible functional units (such as departments or positions).
- Icon Customer Service Png
- Receivable Icon
- Customer Conceptdraw Icon Set
- Basic Flowchart Symbols and Meaning | AWS Architecture Diagrams ...
- Service Technician Icon
- Employee Development Icon
- Agent Icon
- Workflow diagrams - Vector stencils library | Customer Service ...
- Design elements - macOS Toolbar Standalone Icons | App icons ...
- App icons - Vector stencils library | Sales department - Vector ...