Easy Flowchart Program and Standard Flowchart Symbols

How to Discover Critical Path on a Gantt Chart

HelpDesk
How to Use Critical Path Analysis for Scheduling Complex Projects

Activity on Node Network Diagramming Tool

CORRECTIVE ACTIONS PLANNING. Risk Diagram (PDPC)
 *")

Program Evaluation and Review Technique (PERT) with ConceptDraw DIAGRAM
 with ConceptDraw DIAGRAM *")
How To Make the Right Decision in Projects


What is Gantt Chart (historical reference)
 *")
Timeline Examples

Fire Evacuation Plan Template

Object-Oriented Development (OOD) Method
 Method *")
Social Media Response Management Action Maps - software tool


Flowchart Definition

Product Overview

How To create Value Stream Map (VSM)
 *")
Risk Diagram (Process Decision Program Chart)
 *")
Audit Steps

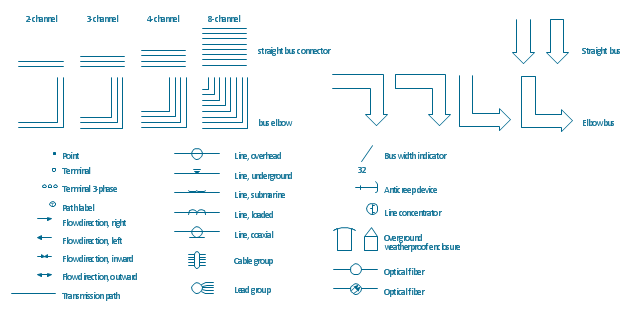
The vector stencils library "Transmission paths" contains 43 symbols of power transmission paths, electronic circuits, bus connectors and elbows, terminals, junctions, and concentrators.
Use it to annotate electrical diagrams, electronic schematics and circuit diagrams.
"A physical medium in data communications is the transmission path over which a signal propagates.
Many transmission media are used as communications channel.
For telecommunications purposes in the United States, Federal Standard 1037C, transmission media are classified as one of the following:
(1) Guided (or bounded) - waves are guided along a solid medium such as a transmission line.
(2) Wireless (or unguided) - transmission and reception are achieved by means of an antenna.
One of the most common physical medias used in networking is copper wire. Copper wire to carry signals to long distances using relatively low amounts of power. The unshielded twisted pair (UTP) is eight strands of copper wire, organized into four pairs.
Another example of a physical medium is optical fiber, which has emerged as the most commonly used transmission medium for long-distance communications. Optical fiber is a thin strand of glass that guides light along its length.
Multimode and single mode are two types of commonly used optical fiber. Multimode fiber uses LEDs as the light source and can carry signals over shorter distances, about 2 kilometers. Single mode can carry signals over distances of tens of miles.
Wireless media may carry surface waves or skywaves, either longitudinally or transversely, and are so classified.
In both communications, communication is in the form of electromagnetic waves. With guided transmission media, the waves are guided along a physical path; examples of guided media include phone lines, twisted pair cables, coaxial cables, and optical fibers. Unguided transmission media are methods that allow the transmission of data without the use of physical means to define the path it takes. Examples of this include microwave, radio or infrared. Unguided media provide a means for transmitting electromagnetic waves but do not guide them; examples are propagation through air, vacuum and seawater.
The term direct link is used to refer to the transmission path between two devices in which signals propagate directly from transmitters to receivers with no intermediate devices, other than amplifiers or repeaters used to increase signal strength. This term can apply to both guided and unguided media.
A transmission may be simplex, half-duplex, or full-duplex.
In simplex transmission, signals are transmitted in only one direction; one station is a transmitter and the other is the receiver. In the half-duplex operation, both stations may transmit, but only one at a time. In full duplex operation, both stations may transmit simultaneously. In the latter case, the medium is carrying signals in both directions at same time." [Transmission medium. Wikipedia]
The shapes example "Design elements - Transmission paths" was drawn using the ConceptDraw PRO diagramming and vector drawing software extended with the Electrical Engineering solution from the Engineering area of ConceptDraw Solution Park.
Transmission path symbols
PERT Chart

How to Create Presentation of Your Project Gantt Chart

- How to Use Critical Path Analysis for Scheduling Complex Projects ...
- How to Discover Critical Path on a Gantt Chart | Program Evaluation ...
- Critical Path Formula
- Business Process Flowchart Symbols | Product Overview | Project ...
- Gantt chart examples | Gantt charts for planning and scheduling ...
- How to Discover Critical Path on a Gantt Chart | Program Evaluation ...
- How to Discover Critical Path on a Gantt Chart | Program Evaluation ...
- Activity on Node Network Diagramming Tool | Basic Flowchart ...
- How to Discover Critical Path on a Gantt Chart | How to Use Critical ...
- How to Use Critical Path Analysis for Scheduling Complex Projects ...
- How to Use Critical Path Analysis for Scheduling Complex Projects ...
- How To Show Critical Path in ConceptDraw PROJECT Server ...
- Critical Path Method in ConceptDraw PROJECT | How to Discover ...
- Gantt chart examples | How to Discover Critical Path on a Gantt ...
- Process Flowchart | Cross-Functional Flowchart | Competitor ...
- Gant Chart in Project Management | ConceptDraw PROJECT ...
- Critical Path Method in ConceptDraw PROJECT | Seven ...
- Program Evaluation and Review Technique (PERT) with ...
- Process Flowchart | How To Create a PERT Chart | Basic Flowchart ...