 Venn Diagrams
Venn Diagrams are actively used to illustrate simple set relationships in set theory and probability theory, logic and statistics, mathematics and computer science, linguistics, sociology, and marketing. Venn Diagrams are also often used to visually summarize the status and future viability of a project.
HelpDesk
How to Create a Venn Diagram

Venn Diagram Examples for Problem Solving. Computer Science. Chomsky Hierarchy

The Venn diagram example below visualizes the the class of language inclusions described by the Chomsky hierarchy.
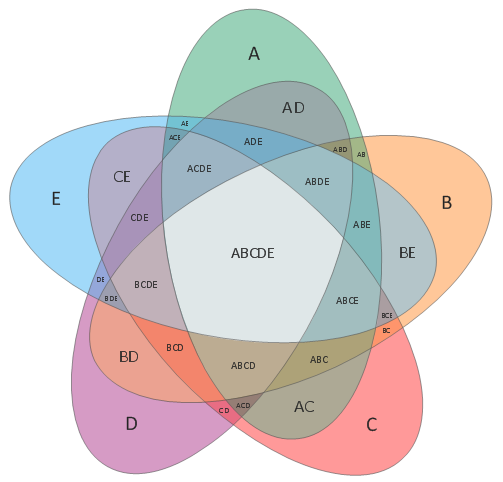
Multi Layer Venn Diagram. Venn Diagram Example

Venn Diagrams

ConceptDraw DIAGRAM diagramming and vector drawing software extended with Venn Diagrams solution from "Diagrams" area offers set of useful drawing tools for easy creating the Venn Diagrams for any quantity of sets.
Venn Diagram Examples for Problem Solving. Venn Diagram as a Truth Table

Cylinder Venn Diagram

Venn Diagram Maker

Interactive Venn Diagram
Venn Diagrams designed in ConceptDraw DIAGRAM are visual, bright, colorful, so they can be successfully used in different reports, appearances on the conferences, meetings.
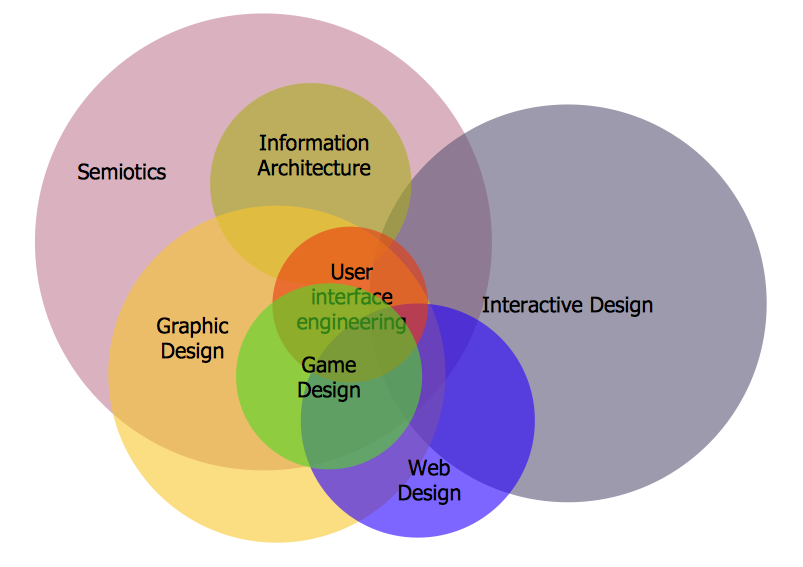
3 Circle Venn Diagram. Venn Diagram Example

Venn Diagrams visualize all possible logical intersections between several sets and are widely used in mathematics, logic, statistics, marketing, sociology, etc.
Venn Diagram Template
3 Circle Venn. Venn Diagram Example

How To Create a Flow Chart in ConceptDraw

Put an initial object from library to a page and use RapidDraw technology clicking on direction arrows to add new objects to the flowchart. This way you can make flowchart quickly.
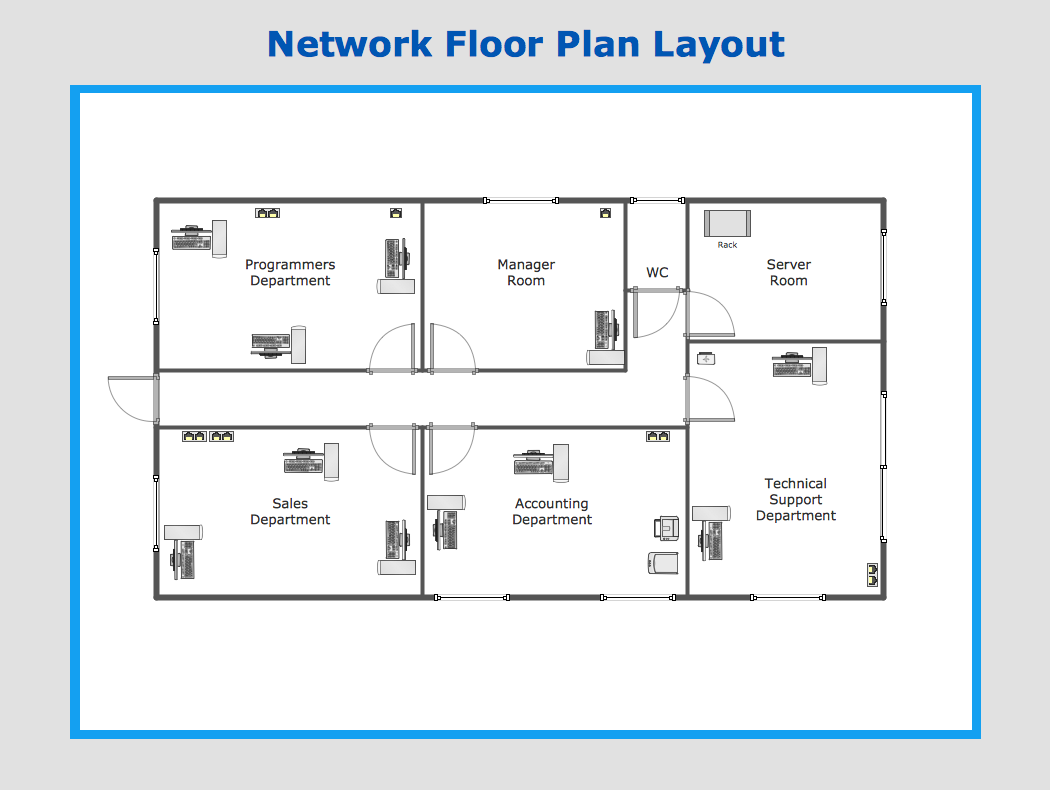
Network Layout

Venn Diagram Template for Word

- Venn Diagrams | Venn Diagram | How to Create a Venn Diagram in ...
- Create Graphs and Charts | Organization Chart Templates | Simple ...
- Venn Diagram Maker Free
- Free Image Venn Diagram
- Venn Diagram | Venn Diagram Examples | Venn Diagram Template ...
- Best Diagramming Software for Mac | Venn Diagram Examples for ...
- Venn Diagrams | Venn Diagrams | How to Create a Venn Diagram in ...
- Venn Diagram Examples for Problem Solving. Venn Diagram as a ...
- Free Sentence Diagrammer | Venn Diagram Examples for Problem ...
- How to Create a Venn Diagram in ConceptDraw PRO | Multi Layer ...
- How to Create a Venn Diagram in ConceptDraw PRO | Venn ...
- Venn diagram - Path to sustainable development | Venn Diagram ...
- Pyramid Chart Maker | Form Maker | Concept Map Maker | Graphic ...
- Process Flowchart | How To Create Restaurant Floor Plan in ...
- Chemistry | Biology | Astronomy | Example Of Solution In Science
- Pyramid Chart Maker | Concept Map Maker | Form Maker | Free ...
- Venn Diagram Examples for Problem Solving. Computer Science ...
- Venn Diagram Examples for Problem Solving. Environmental Social ...
- Venn Diagram Examples for Problem Solving. Computer Science ...
- Line Chart Template for Word | Bar Chart Template for Word | Venn ...
- ERD | Entity Relationship Diagrams, ERD Software for Mac and Win
- Flowchart | Basic Flowchart Symbols and Meaning
- Flowchart | Flowchart Design - Symbols, Shapes, Stencils and Icons
- Flowchart | Flow Chart Symbols
- Electrical | Electrical Drawing - Wiring and Circuits Schematics
- Flowchart | Common Flowchart Symbols
- Flowchart | Common Flowchart Symbols