Competitor Analysis

Competitive Feature Comparison Matrix is a tool to compare the features and functionality of competitive products or services in side-by-side table.
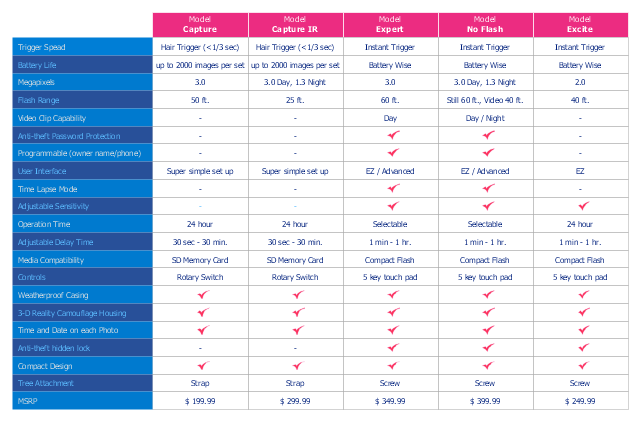
The feature comparison matrices are used for feature comparison analysis of competitive products and services.
This competitive feature comparison matrix chart example was created using the ConceptDraw PRO diagramming and vector drawing software extended with the Matrices solution from the Marketing area of ConceptDraw Solution Park.
Feature comparison chart
SWOT analysis matrix diagram templates

Sales Teams are Inherently Competitive
Business Tools Perceptual Mapping

Product Planning

Matrices

What is SWOT Analysis?

SWOT analysis Software & Template for Macintosh and Windows

SWOT Sample in Computers

SWOT Analysis Software

SWOT Analysis Solution - Strategy Tools

In marketing perceptual or positioning maps are used for developing the market positioning strategy for product or service.
"Perceptual mapping is a diagrammatic technique used by asset marketers that attempts to visually display the perceptions of customers or potential customers. Typically the position of a product, product line, brand, or company is displayed relative to their competition." [Perceptual mapping. Wikipedia]
This positioning map diagram example was created using the ConceptDraw PRO diagramming and vector drawing software extended with the Matrices solution from the Marketing area of ConceptDraw Solution Park.
Perceptual map

Ansoff Matrix

Swot Analysis Examples

How to Make SWOT Analysis in a Word Document

Positioning Map

 Marketing Diagrams
Marketing Diagrams solution extends ConceptDraw DIAGRAM diagramming software with abundance of samples, templates and vector design elements intended for easy graphical visualization and drawing different types of Marketing diagrams and graphs, including Branding Strategies Diagram, Five Forces Model Diagram, Decision Tree Diagram, Puzzle Diagram, Step Diagram, Process Chart, Strategy Map, Funnel Diagram, Value Chain Diagram, Ladder of Customer Loyalty Diagram, Leaky Bucket Diagram, Promotional Mix Diagram, Service-Goods Continuum Diagram, Six Markets Model Diagram, Sources of Customer Satisfaction Diagram, etc. Analyze effectively the marketing activity of your company and apply the optimal marketing methods with ConceptDraw DIAGRAM software.
 Presentation Clipart
Presentation design elements solution extends ConceptDraw DIAGRAM software with slide samples, templates and vector stencils libraries with design elements of presentation symbols, arrows, callouts, backgrounds, borders and frames, title blocks.
This circle-spoke diagram sample shows the Porter five forces model. It was designed on the base of the Wikimedia Commons file: Modelo Porter.png. [commons.wikimedia.org/ wiki/ File:Modelo_ Porter.png]
"Porter's five forces analysis is a framework that attempts to analyze the level of competition within an industry and business strategy development. It draws upon industrial organization (IO) economics to derive five forces that determine the competitive intensity and therefore attractiveness of an Industry. Attractiveness in this context refers to the overall industry profitability. An "unattractive" industry is one in which the combination of these five forces acts to drive down overall profitability. A very unattractive industry would be one approaching "pure competition", in which available profits for all firms are driven to normal profit. This analysis is associated with its principal innovator Michael E. Porter of Harvard University. ...
Porter's five forces include – three forces from 'horizontal' competition: the threat of substitute products or services, the threat of established rivals, and the threat of new entrants; and two forces from 'vertical' competition: the bargaining power of suppliers and the bargaining power of customers." [Porter's five forces analysis. Wikipedia]
The hub-and-spoke diagram example "Porter five forces model" was created using the ConceptDraw PRO diagramming and vector drawing software extended with the Circle-Spoke Diagrams solution from the area "What is a Diagram" of ConceptDraw Solution Park.
Circle-spoke diagram

- Competitive strategy matrix - Template | Competitive Matrix Template
- Porter's generic strategies matrix diagram | Block diagram - Porter's ...
- Competitive Threat Analysis
- Porter's generic strategies matrix diagram | Porter's Value Chain ...
- SWOT Analysis | Sales Teams are Inherently Competitive | SWOT ...
- Porter's generic strategies matrix diagram | Porter's Value Chain ...
- Porter's Value Chain | Competitor Analysis | Block diagram - Porter's ...
- Competitor Analysis | Positioning map | Positioning Map | Market ...
- Block diagram - Porter's five forces model | Porter's Value Chain ...
- Block diagram - Porter's five forces model | Matrices | Marketing ...
- Positioning Map | Risk Positioning Diagram | Infield Positioning for ...
- How to Make an Ansoff Matrix Template in ConceptDraw PRO ...
- Porter's Value Chain | Porter's value chain matrix diagram | Porter's ...
- Competitor Analysis | Pie Donut Chart. Pie Chart Examples | Pie ...
- Porter's value chain matrix diagram | Design elements - Matrices ...
- Positioning map | Positioning Map | Competitor Analysis ...
- Positioning map | Competitor Analysis | Service 8 Ps fishbone ...
- Competitor Analysis
- Positioning map
- Competitor Analysis | Positioning map | Brand essence model ...