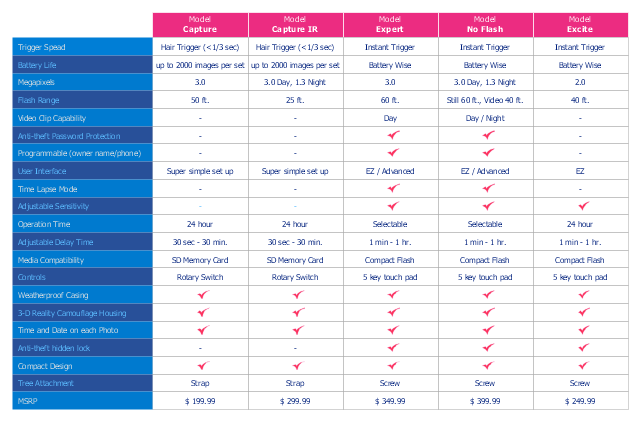
Competitive Feature Comparison Matrix is a tool to compare the features and functionality of competitive products or services in side-by-side table.
The feature comparison matrices are used for feature comparison analysis of competitive products and services.
This competitive feature comparison matrix chart example was created using the ConceptDraw PRO diagramming and vector drawing software extended with the Matrices solution from the Marketing area of ConceptDraw Solution Park.
Feature comparison chart
Computer Hardware - Reseller Business Plan

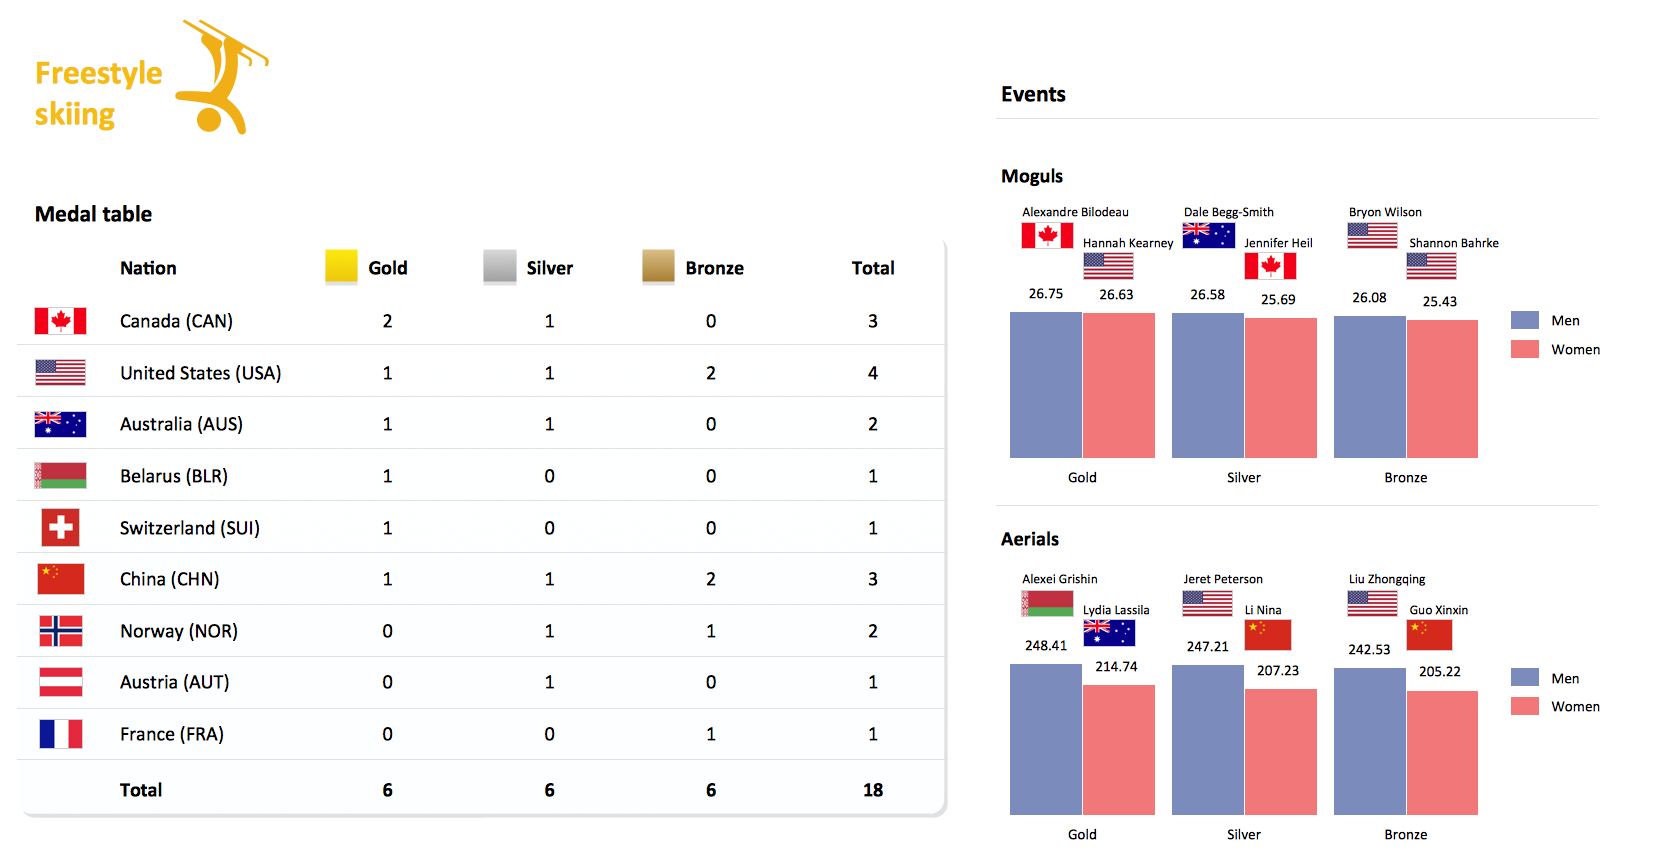
Winter Sports. Olympic Games Illustrations. Medal Summary
This pitch plan sample was designed on the base of the Wikipedia file: Comparison sport playing areas.svg.
[en.wikipedia.org/ wiki/ File:Comparison_ sport_ playing_ areas.svg]
This file is licensed under the Creative Commons Attribution-Share Alike 3.0 Unported license. [creativecommons.org/ licenses/ by-sa/ 3.0/ deed.en]
"A pitch is an outdoor playing area for various sports. The term is used in British and Australian English; the comparable term in American English is playing field. In most sports, the official technical term is field of play, although this is not regularly used by those outside of refereeing/ umpiring circles.
In the sport of cricket, the cricket pitch refers not to the entire field of play, but to the section of the field on which batting and bowling take place in the centre of the field. The pitch is prepared differently to the rest of the field, to provide a harder surface for bowling.
A pitch is often a regulation space, as in an association football pitch." [Pitch (sports field). Wikipedia]
The pitch plan example "Sport fields comparison" was created using the ConceptDraw PRO diagramming and vector drawing software extended with the Sport Field Plans solution from the Building Plans area of ConceptDraw Solution Park.
Pitch plans

HelpDesk
How to Track Your Project Plan vs. the Actual Project Condition

Ansoff Matrix

Chart Maker for Presentations

SWOT Analysis

Venn Diagram

Looking at ConceptDraw MINDMAP as a Replacement for Mindjet Mindmanager

HelpDesk
How to Create SWOT Analysis Template

This pie chart sample shows the make up of the top one percent of United States wage earners, grouped by occupation. Data for this graph is sourced from the November 2010 report written by Jon Bakija, Adam Cole, and Bradley T. Heim titled "Jobs and Income Growth of Top Earners and the Causes of Changing Income Inequality: Evidence from U.S. Tax Return Data", column "2005" in table 2, titled "Percentage of primary taxpayers in top one percent of the distribution of income (excluding capital gains) that are in each occupation", on page 50.
This pie chart sample was redesigned from the Wikimedia Commons file: Percentage of the top 1% wage earners in the United States by occupation (pie chart).svg.
[commons.wikimedia.org/ wiki/ File:Percentage_ of_ the_ top_ 1%25_ wage_ earners_ in_ the_ United_ States_ by_ occupation_ (pie_ chart).svg]
This file is licensed under the Creative Commons Attribution-Share Alike 3.0 Unported license. [creativecommons.org/ licenses/ by-sa/ 3.0/ deed.en]
"The distribution of wealth is a comparison of the wealth of various members or groups in a society. It differs from the distribution of income in that it looks at the distribution of ownership of the assets in a society, rather than the current income of members of that society." [Distribution of wealth. Wikipedia]
The pie chart example "Percentage of the top 1% wage earners in the US by occupation" was created using the ConceptDraw PRO diagramming and vector drawing software extended with the Pie Charts solutiton of the Graphs and Charts area in ConceptDraw Solution Park.
Pie chart

 Cooking Recipes
Create quick and easy recipe diagrams with the Cooking Recipes solution. Make a tasty meal for dinner, for holidays, or for a party.
Business Productivity - Marketing

 Chemistry
This solution extends ConceptDraw DIAGRAM software with samples, template and libraries of vector stencils for drawing the Chemistry Illustrations for science and education.
- Comparison Table Sample
- Powerpoint Template Comparison Table
- Comparison Table Between Iaas And Paas
- Chores Table
- Competitor Comparison Table
- Furniture - Vector stencils library | Sport fields comparison | Table ...
- Sport fields comparison | Furniture - Vector stencils library | Table ...
- Competitive feature comparison matrix chart - Digital scouting ...
- Matrix Table Chart Sample
- Competitor Analysis | Competitive feature comparison matrix chart ...
- Competitive feature comparison matrix chart - Digital scouting cameras
- Feature Comparison Chart Software | Competitive feature ...
- Feature Comparison Chart Software | SWOT analysis matrix ...
- Competitive feature comparison matrix chart
- Composition Conversion Of Graphics Pie Chart Bar Chart Table
- Comparing ConceptDraw PRO to Omnigraffle | Comparison ...
- Excel Comparison Table Template
- Feature Comparison Chart Software | Bar Chart Template for Word ...
- Comparison Template Powerpoint