This site uses cookies. By continuing to browse the ConceptDraw site you are agreeing to our Use of Site Cookies.

Presentation Preparation using Mind Maps

Whenever you need quick presentations, the ability to choose specific content, the ability to focus on specific stakeholder needs, update data, or create polished slide decks — ConceptDraw MINDMAP provides a presentation solution for you.

How To Make an Effective PowerPoint Presentation

ConceptDraw MINDMAP is an advanced tool for making an effective PowerPoint presentation.

Feature Comparison Chart Software

An example of marketing analysis diagram, can be used to analyse product market and define marketing strategy.
This sample shows the Feature Comparison Chart of the digital scouting cameras. It can be useful for digital cameras production field, marketing, sales, etc.

How to Create Presentation of Your Project Gantt Chart

During the planning, discussing and execution of a project you may need to prepare a presentation using project views such as the Gantt Chart, Multiproject Dashboard or Resource Usage View. It’s easy do with ConceptDraw PROJECT!

Financial Comparison Chart

This sample shows the Bar Chart of the leverage ratios for two major investment banks. The leverage ratio is the ratio of the total debt to the total equity; it is a measure of the risk taken by the bank. The higher of the leverage ratio denotes the more risk, the greater risks can lead to the subprime crisis.

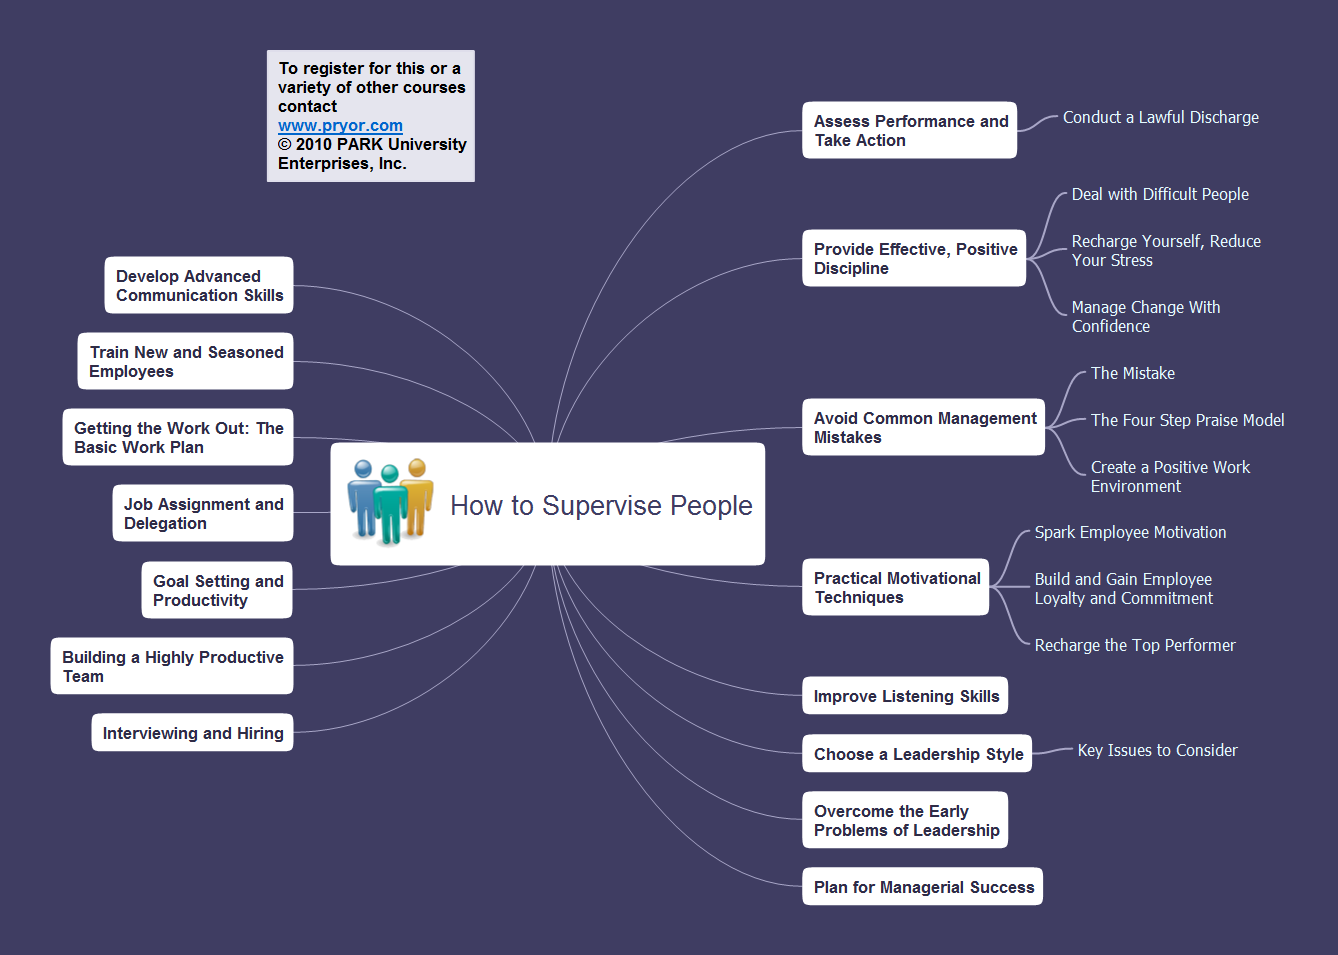
How To Do A Mind Map In PowerPoint

ConceptDraw MINDMAP - an excellent tool for exporting mind maps to PowerPoint to visualize and presenting your project. You can simply generate, change, update your mindmap and then make a presentation in PowerPoint.

Sales Growth. Bar Graphs Example

This sample was created in ConceptDraw DIAGRAM diagramming and vector drawing software using the Bar Graphs Solution from Graphs and Charts area of ConceptDraw Solution Park. It is Bar Graphs example, Sales Growth example, Column Chart Example - Sales Report.

comparison chart, indicators Comparison Dashboard

comparison chart, indicators
Comparison dashboard solution extends ConceptDraw DIAGRAM software with samples, templates and vector stencils library with charts and indicators for drawing the visual dashboard comparing data.

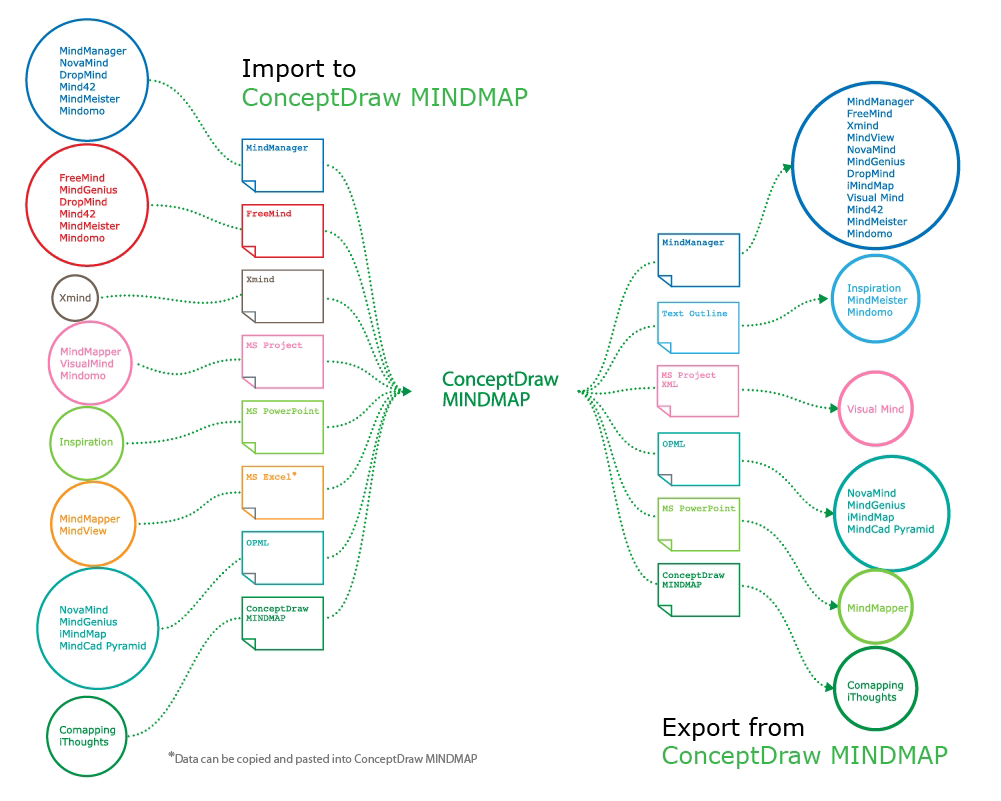
How to Exchange ConceptDraw MINDMAP Files with Mindjet MindManager

ConceptDraw MINDMAP has impressive import and export capabilities includes following formats:

OPML
Mindjet™ MindManager™
Microsoft™ Office products:
PowerPoint™
Project™
Word™
FreeMind (import only)
XMind (import only)
How to exchange ConceptDraw MINDMAP Files with Mindjet Mindmanager

Relative Value Chart Software

Relative value is a value measured in the terms of liquidity, risks, return of one investment or financial instrument relative to another.
Relative values are widely used in:business, economics, investment, management, marketing, statistics, etc.
ConceptDraw DIAGRAM software is the best for drawing professional looking Relative Value Charts. ConceptDraw DIAGRAM provides Divided Bar Diagrams solution from the Graphs and Charts Area of ConceptDraw Solution Park.