Comparing ConceptDraw DIAGRAM to Omnigraffle

 Comparison Dashboard
Comparison dashboard solution extends ConceptDraw DIAGRAM software with samples, templates and vector stencils library with charts and indicators for drawing the visual dashboard comparing data.
Feature Comparison Chart Software

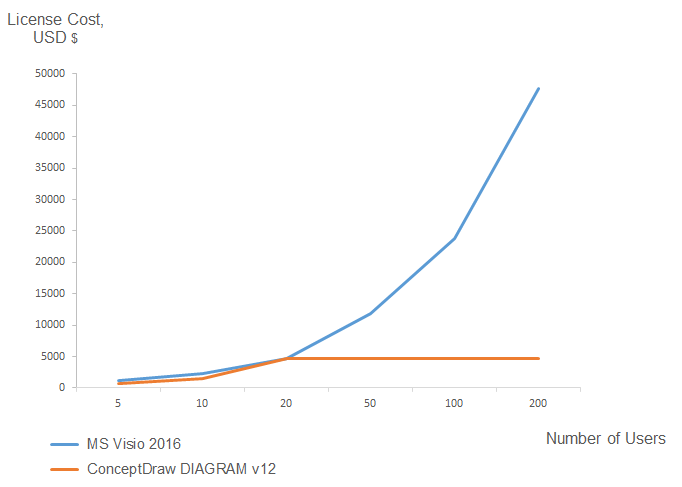
ConceptDraw DIAGRAM Comparison with Omnigraffle Professional and MS Visio

Financial Comparison Chart

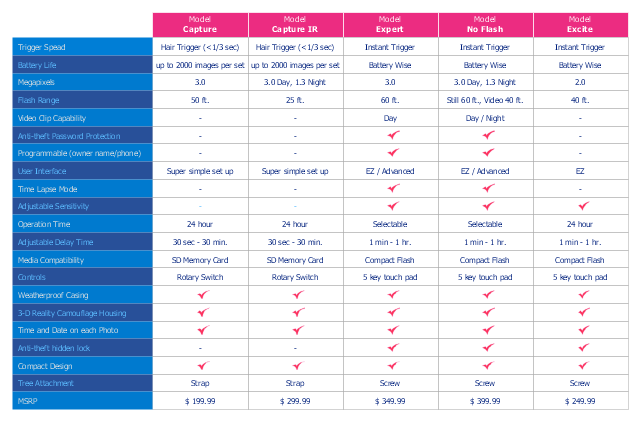
Competitive Feature Comparison Matrix is a tool to compare the features and functionality of competitive products or services in side-by-side table.
The feature comparison matrices are used for feature comparison analysis of competitive products and services.
This competitive feature comparison matrix chart example was created using the ConceptDraw PRO diagramming and vector drawing software extended with the Matrices solution from the Marketing area of ConceptDraw Solution Park.
Feature comparison chart
Comparison List
HelpDesk
Replace Your Current Diagramming Tool
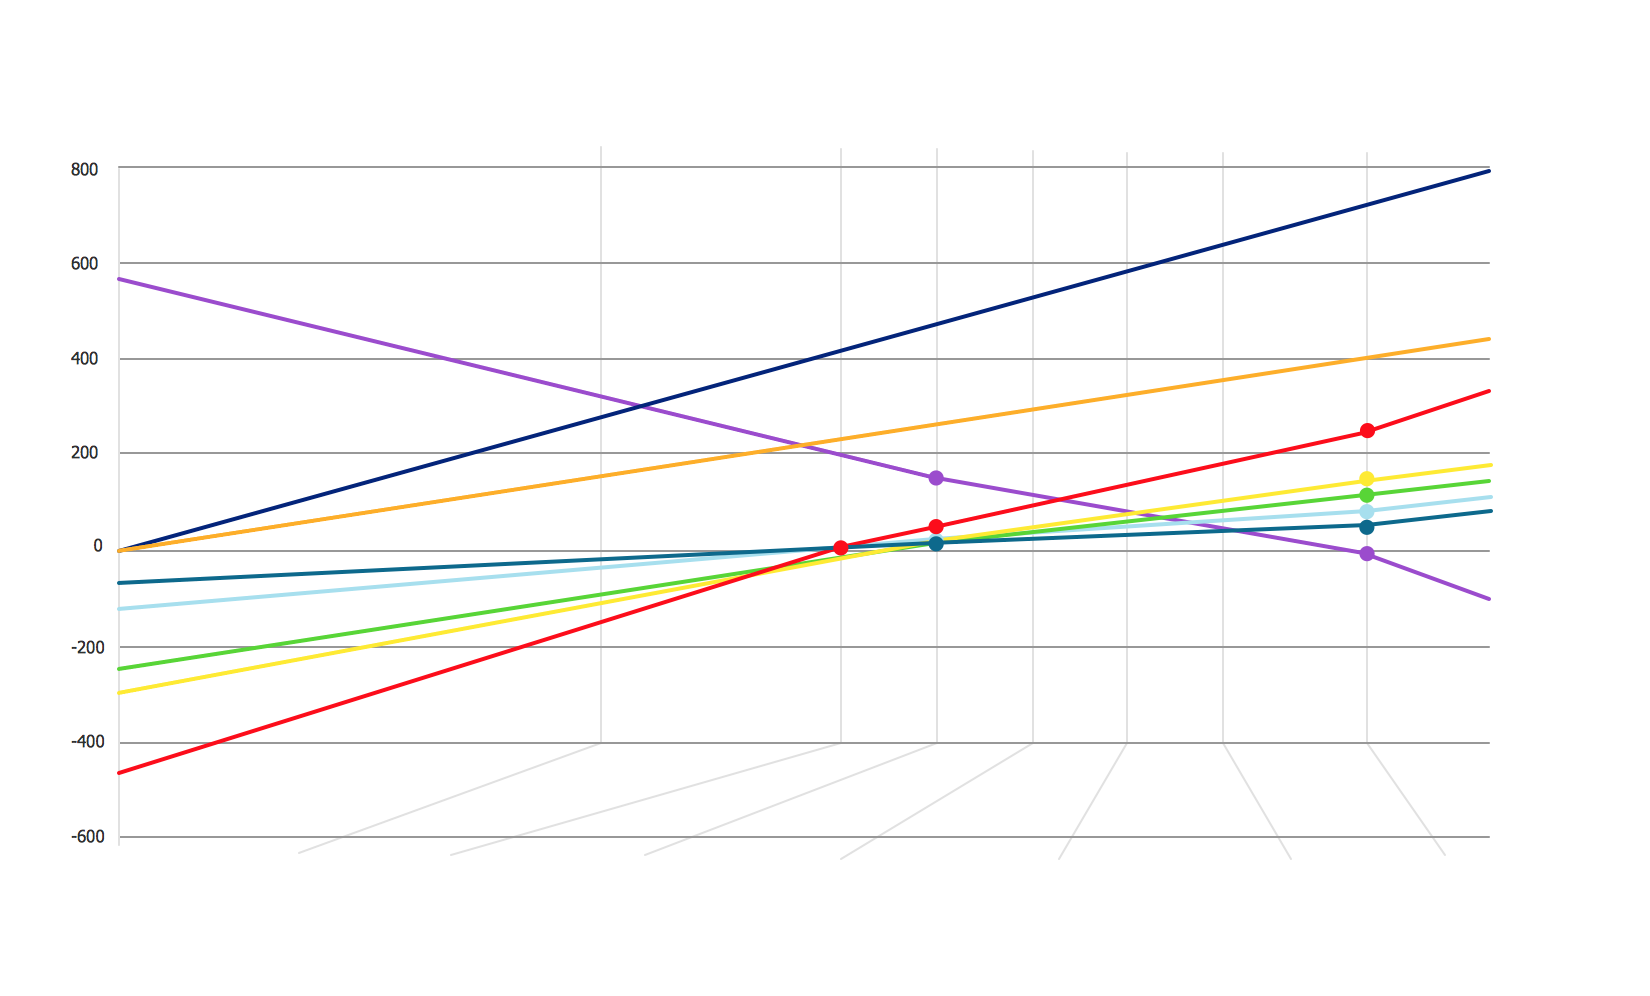
The vector stencils library Comparison charts contains 4 Live Objects: Horizontal bar chart, Column chart (Vertical bar chart), Line chart and Dot plot (Scatter chart).
The vector stencils library Comparison indicators contains 7 Live Objects:
Two column indicator, Two bubbles indicator, Scales indicator, Left and right arrows indicator, Up and down arrows indicator, Two up arrows indicator.
The ConceptDraw Live Objects are ready-to-use templates of charts and visual indicators for dashboard design. You can set data source file for Each Live Object, and your charts or indicators will represents actual data from the data source files, and change their appearance with changing of the data in source files. The comparison charts and indicators are useful to compare and rank of your data by categories.
Use the design elements libraries "Comparison charts" and "Comparison indicators" to create your own business visual dashboards using the ConceptDraw PRO diagramming and vector drawing software.
The example "Design elements - Comparison charts and indicators" is included in the Comparison Dashboard solution from the area "What is a Dashboard" of ConceptDraw Solution Park.
Data comparison charts and visual indicators

 ConceptDraw Solution Park
ConceptDraw Solution Park collects graphic extensions, examples and learning materials
Looking at ConceptDraw MINDMAP as a Replacement for Mindjet Mindmanager

ConceptDraw DIAGRAM Compatibility with MS Visio

This pitch plan sample was designed on the base of the Wikipedia file: Comparison sport playing areas.svg.
[en.wikipedia.org/ wiki/ File:Comparison_ sport_ playing_ areas.svg]
This file is licensed under the Creative Commons Attribution-Share Alike 3.0 Unported license. [creativecommons.org/ licenses/ by-sa/ 3.0/ deed.en]
"A pitch is an outdoor playing area for various sports. The term is used in British and Australian English; the comparable term in American English is playing field. In most sports, the official technical term is field of play, although this is not regularly used by those outside of refereeing/ umpiring circles.
In the sport of cricket, the cricket pitch refers not to the entire field of play, but to the section of the field on which batting and bowling take place in the centre of the field. The pitch is prepared differently to the rest of the field, to provide a harder surface for bowling.
A pitch is often a regulation space, as in an association football pitch." [Pitch (sports field). Wikipedia]
The pitch plan example "Sport fields comparison" was created using the ConceptDraw PRO diagramming and vector drawing software extended with the Sport Field Plans solution from the Building Plans area of ConceptDraw Solution Park.
Pitch plans

Sales Growth. Bar Graphs Example

Bar Diagrams for Problem Solving. Create business management bar charts with Bar Graphs Solution

- ConceptDraw PRO 9 Comparison with Omnigraffle Professional and ...
- Feature Comparison Chart Software | Competitive feature ...
- Feature Comparison Chart Software | Matrices | BCG Matrix | Matrix ...
- Chore charts with ConceptDraw PRO | Competitive feature ...
- How to Connect Text Data to a Time Series Chart on Your Live ...
- Competitive feature comparison matrix chart - Digital scouting cameras
- Feature Comparison Chart Software | SWOT analysis matrix ...
- Comparison Dashboard | ConceptDraw Solution Park | Composition ...
- Feature Comparison Chart Software | How to Create SWOT Analysis ...
- Comparison indicators - Vector stencils library | Design elements ...
- Comparing ConceptDraw PRO to Omnigraffle | ConceptDraw PRO 9 ...
- Workflow Diagrams | Comparison Dashboard | ConceptDraw ...
- Feature Comparison Chart Software | Bar Chart Template for Word ...
- Comparison Dashboard | Feature Comparison Chart Software ...
- Comparison indicators - Vector stencils library | Performance ...
- Marketing | PM Agile | Comparison Dashboard | Comparison Table ...
- Feature Comparison Chart Software | Bar Chart Template for Word ...
- Comparing ConceptDraw PRO to Omnigraffle | Comparison ...
- Bar Chart Template for Word | Comparison charts - Vector stencils ...
- Matrices | Marketing | Competitive feature comparison matrix chart ...