Comparison List
This sample was created in ConceptDraw DIAGRAM diagramming and vector drawing software using the Basic Diagramming Solution from the Universal Diagramming area of ConceptDraw Solution Park.
This sample shows the Comparison List Chart that displays graphically the temperatures in the various systems of measurement and allows to compare them. The Comparison Charts are widely used in the different fields such as business, management, analytics, etc.
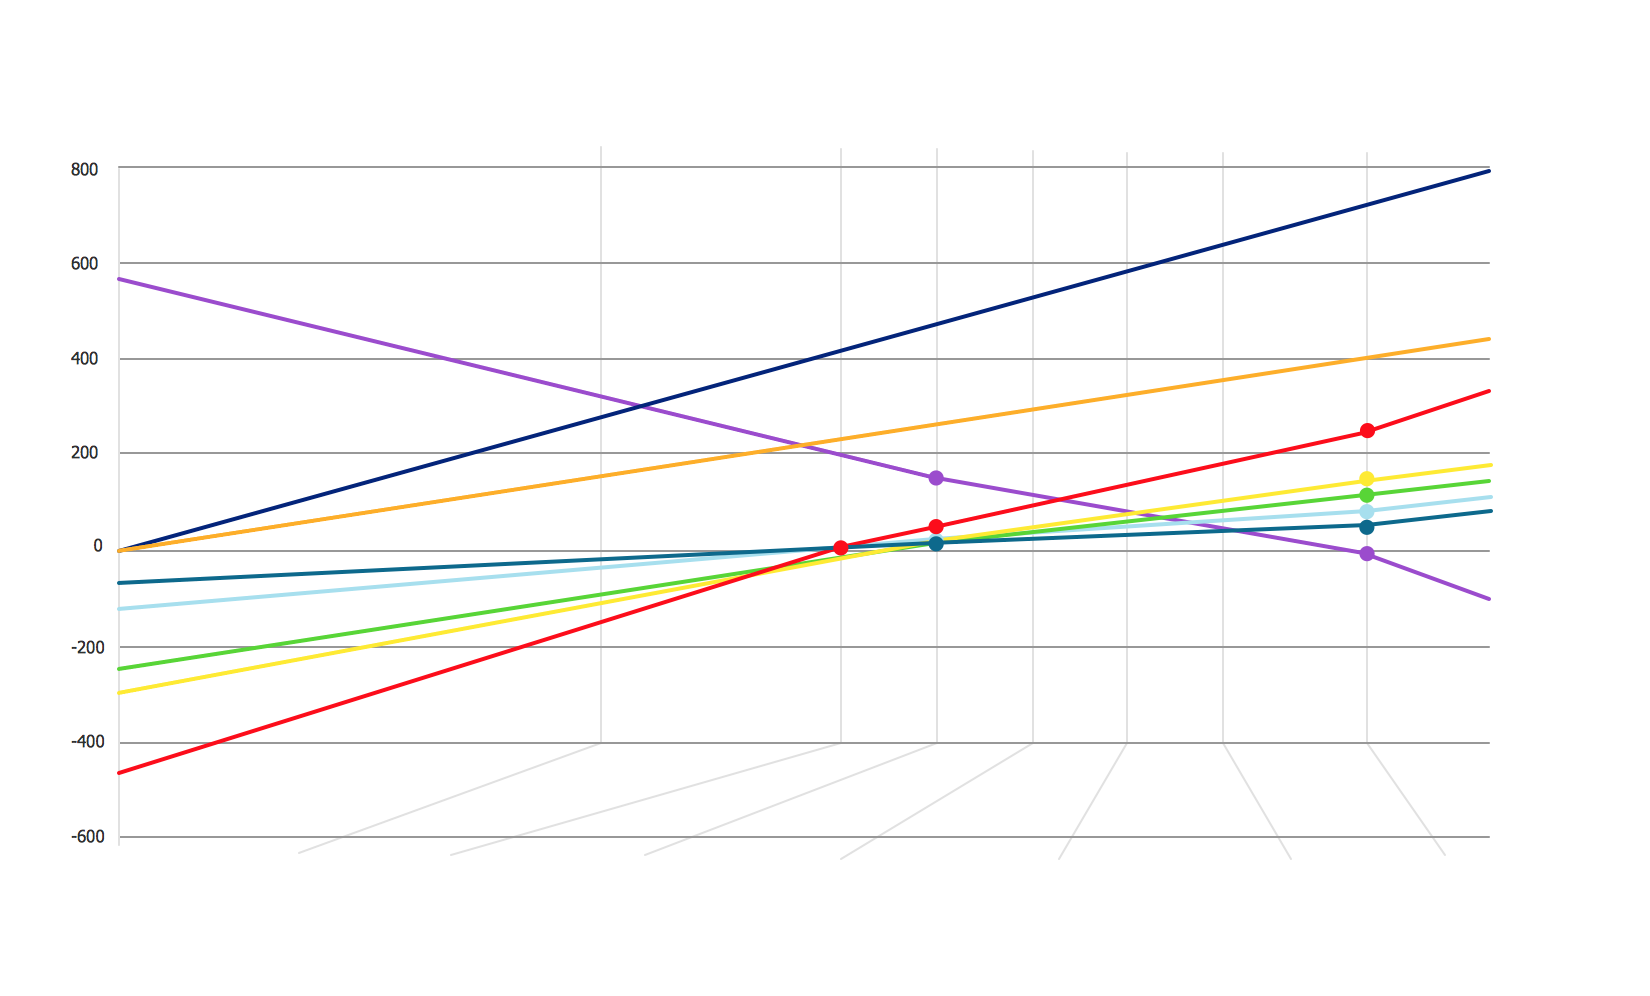
Example 1. Comparison List
This diagram was redrawn from commons.wikimedia.org.
Using the ready-to-use predesigned objects from the Basic Diagramming Solution for ConceptDraw DIAGRAM you can create your own professional looking charts and diagrams quick and easy.
The charts and diagrams produced with ConceptDraw DIAGRAM are vector graphic documents and are available for reviewing, modifying, and converting to a variety of formats (image, HTML, PDF file, MS PowerPoint Presentation, Adobe Flash or MS Visio).
Free Download Comparison List Software and View All Examples
See also Samples:
- Business Charts — Pie and Donut
- Business Charts — Bar and Histogram
- Business Charts — Area, Line and Scatter
- Marketing — Charts & Diagrams
- Flowcharts
- Orgcharts
- Quality and Manufacturing Charts
- Business Process Diagrams — Flow Charts
- Marketing — Flowcharts & Process Diagrams
- Business Diagrams — Concept Maps
- Business processes — Flow charts
- Marketing — Flowcharts and Process Diagrams
- Finance and Accounting
- Marketing — Social Media
- Business Diagrams
- Business Charts — Bar and Histogram


