UML Class Diagram Example - Medical Shop

UML Component Diagram Example - Online Shopping

State Diagram Example — Online Store

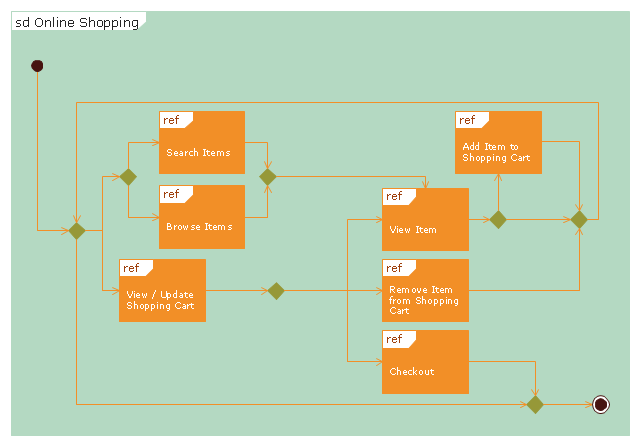
"Online shopping or e-shopping is a form of electronic commerce which allows consumers to directly buy goods or services from a seller over the Internet using a web browser. Alternative names are: e-web-store, e-shop, e-store, Internet shop, web-shop, web-store, online store, online storefront and virtual store. Mobile commerce (or m-commerce) describes purchasing from an online retailer's mobile optimized online site or app.
An online shop evokes the physical analogy of buying products or services at a bricks-and-mortar retailer or shopping center; the process is called business-to-consumer (B2C) online shopping. In the case where a business buys from another business, the process is called business-to-business (B2B) online shopping. The largest of these online retailing corporations are Alibaba, Amazon.com, and eBay. Retail success is no longer all about physical stores. This is evident because of the increase in retailers now offering online store interfaces for consumers. With the growth of online shopping, comes a wealth of new market footprint coverage opportunities for stores that can appropriately cater to offshore market demands and service requirements." [Online shopping. Wikipedia]
The UML interaction overview diagram example "Online shopping" was created using the ConceptDraw PRO diagramming and vector drawing software extended with the Rapid UML solution from the Software Development area of ConceptDraw Solution Park.
UML interaction overview diagram
UML Component Diagram


UML Class Diagram Example for GoodsTransportation System

UML Use Case Diagram Example - Estate Agency

Sales Process Map

Structured Systems Analysis and Design Method. SSADM with ConceptDraw DIAGRAM

Create a Presentation Using a Design Template

Software development with ConceptDraw DIAGRAM

ConceptDraw DIAGRAM ER Diagram Tool

Chemistry Symbols and Meanings

 Computer Network Diagrams
Computer Network Diagrams solution extends ConceptDraw DIAGRAM software with samples, templates and libraries of vector icons and objects of computer network devices and network components to help you create professional-looking Computer Network Diagrams, to plan simple home networks and complex computer network configurations for large buildings, to represent their schemes in a comprehensible graphical view, to document computer networks configurations, to depict the interactions between network's components, the used protocols and topologies, to represent physical and logical network structures, to compare visually different topologies and to depict their combinations, to represent in details the network structure with help of schemes, to study and analyze the network configurations, to communicate effectively to engineers, stakeholders and end-users, to track network working and troubleshoot, if necessary.
 School and Training Plans
School and Training Plans solution enhances ConceptDraw DIAGRAM functionality with extensive drawing tools, numerous samples and examples, templates and libraries of classroom design elements for quick and professional drawing the School and Training plans, School Floor plans, Classroom Layout, Classroom Seating chart, Lecture Room plans of any complexity. Each offered classroom seating chart template is a real help for builders, designers, engineers, constructors, as well as teaching personnel and other teaching-related people in drawing Classroom Seating charts and Training Room layouts with ConceptDraw DIAGRAM classroom seating chart maker.
Software Diagram Templates

Gane Sarson Diagram

UML Deployment Diagram Example - ATM System UML diagrams

How to Draw EPC Diagram Quickly


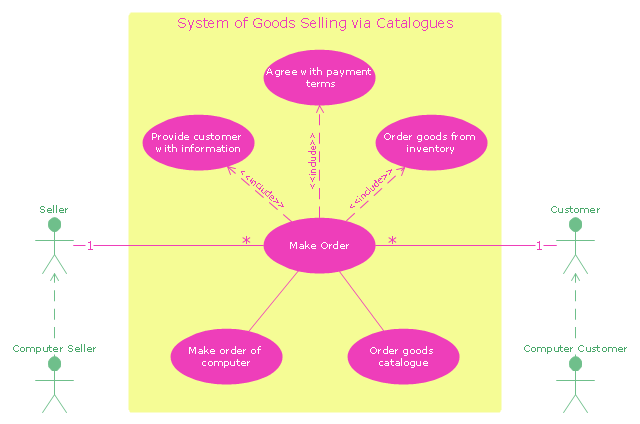
"A catalog merchant (catalogue merchant in British and Canadian English) is a form of retailing. The typical merchant sells a wide variety of household and personal products, with many emphasizing jewelry. Unlike a self-serve retail store, most of the items are not displayed; customers select the products from printed catalogs in the store and fill out an order form. The order is brought to the sales counter, where a clerk retrieves the items from the warehouse area to a payment and checkout station. ...
The catalog merchant has generally lower prices than other retailers and lower overhead expenses due to the smaller size of store and lack of large showroom space.
There are a few key benefits to this approach. By operating as an in-store catalog sales center, it could be exempt from the "Resale price maintenance" policy of the manufacturers, which can force conventional retailers to charge a minimum sales price to prevent price-cutting competition; it also reduces the risk of merchandise theft, known in the industry as shrinkage.
From the consumer's point of view, there are potential advantages and disadvantages. The catalog showroom approach allows customers to shop without having to carry their purchases throughout the store as they shop. Possible downsides include that customers may be required to give their contact information when an order is placed, take the time to fill out order forms, and wait a period of time for their order to be available for purchase. This wait may be days long, one of the chief vulnerabilities of the catalog showroom approach." [Catalog merchant. Wikipedia]
The UML use case diagram example "System of goods selling via catalogues" was created using the ConceptDraw PRO diagramming and vector drawing software extended with the Rapid UML solution from the Software Development area of ConceptDraw Solution Park.
UML use case diagram
- UML Class Diagram Generalization Example UML Diagrams
- UML Component Diagram Example - Online Shopping | UML Class ...
- State Diagram Example — Online Store | UML Composite Structure ...
- Class Diagram For Online Shopping Hd Images
- State Diagram Example — Online Store | UML Class Diagram ...
- Class Diagram Online Shopping System
- Free Download Class Diagram For Online Shopping System
- Class Diagram For Online Pharmacy Management System
- Draw Class Diagram For Online Shopping
- Uml Diagram For Online Shopping System Download
- UML Component Diagram Example - Online Shopping | State ...
- Pdf Of All Uml Diagrams Of Online Shopping System
- Class Diagram For Online Gift Shop Management System
- UML Deployment Diagram. Design Elements | UML Class Diagram ...
- Component Diagram For Online Shopping System
- UML Class Diagram Example - Medical Shop | State Diagram ...
- UML Component Diagram Example - Online Shopping | UML ...
- Example of DFD for Online Store (Data Flow Diagram ) | UML ...
- Uml Diagram For Online Shopping System Ppt