This site uses cookies. By continuing to browse the ConceptDraw site you are agreeing to our Use of Site Cookies.

Geo Map - Asia - China

China, officially the People's Republic of China, is a sovereign state located in East Asia.
The vector stencils library China contains contours for ConceptDraw DIAGRAM diagramming and vector drawing software. This library is contained in the Continent Maps solution from Maps area of ConceptDraw Solution Park.

Geo Map - South America - Chile

Chile, officially the Republic of Chile, is a South American country occupying a long, narrow strip of land between the Andes mountains to the east and the Pacific Ocean to the west.
The vector stencils library Chile contains contours for ConceptDraw DIAGRAM diagramming and vector drawing software. This library is contained in the Continent Maps solution from Maps area of ConceptDraw Solution Park.

Geo Map - Canada - Nunavut

Nunavut is the largest, northernmost and newest territory of Canada.
The vector stencils library Nunavut contains contours for ConceptDraw DIAGRAM diagramming and vector drawing software. This library is contained in the Continent Maps solution from Maps area of ConceptDraw Solution Park.

Geo Map - Asia - North Korea

North Korea, officially the Democratic People's Republic of Korea, is a country in East Asia, in the northern part of the Korean Peninsula.
The vector stencils library North Korea contains contours for ConceptDraw DIAGRAM diagramming and vector drawing software. This library is contained in the Continent Maps solution from Maps area of ConceptDraw Solution Park.

What is the Accounting Cycle?

What is the accounting cycle? The accounting cycle is a sequence of steps that occur in the accounting period and include the processes of identifying, collecting, analyzing documents, recording transactions, classifying, summarizing, and reporting financial information of an organization.

Audit Flowchart Symbols

Audit Flowchart helps you draw auditing diagrams for accounting, finance and money management, fiscal information tracking, decision making flow charts, financial inventories and documenting Six Sigma and ISO 9000 business processes.
Audit Flowchart Symbols - It’s efficiently to use the colors creating the audit flowcharts to make them bright, visual, attractive and successful. The best flowchart maker use ConceptDraw DIAGRAM features of RapidDraw technique.

Visualize Stakeholder Analysis

Stakeholder analysis in conflict resolution, project management, and business administration, is the process of identifying the individuals or groups that are likely to affect or be affected by a proposed action, and sorting them according to their impact on the action and the impact the action will have on them.
Use the ConceptDraw DIAGRAM diagramming and vector drawing software enhanced with powerful tools of Stakeholder Onion Diagrams Solution from the Management Area of ConceptDraw Solution Park to easy and effectively visualize stakeholder analysis.
HelpDesk

How to Create an Audit Flowchart

Audit flowcharts are often used in auditors activity. This is the most effective way of preparation and documentation of the audit process. Financial audit process has a clear structure, and therefore audit flowchart is often used to denote an audit process. This is the most effective way of preparation and documentation of the audit process. Flowcharts are often used in auditors activity. A flowchart may be created at any stage of an audit process as an aid in the determination and evaluation of a client's accounting system. ConceptDraw DIAGRAM allows you to create professional accounting flowchart quickly using the professional Audit Flowcharts solution.

Chart Audit

ConceptDraw DIAGRAM enhanced with Audit Flowcharts solution from the Finance and Accounting area of ConceptDraw Solution Park is a powerful diagramming and vector drawing software for designing professional looking Chart Audit of any complexity.
Chart Audit is incredibly convenient for representing important information about audit process and audit planning process. It also helps auditors to define the problem areas and to elaborate the ways of their solving and effectiveness improvement.

Auditing Standards

Auditing standards ensure a measure of audit quality and the objectives which must to be achieved in an audit. Illustrations are convenient way for auditors and audit-related people to display the auditing standards. We recommend to use the ConceptDraw DIAGRAM diagramming and vector drawing software extended with Audit Flowcharts solution from the Finance and Accounting area for designing professional looking and attractive Audit Flowcharts.

human resources, human resource management, recruitment, hiring process, human resource development HR Flowcharts

human resources, human resource management, recruitment, hiring process, human resource development
Human resource management diagrams show recruitment models, the hiring process and human resource development of human resources.
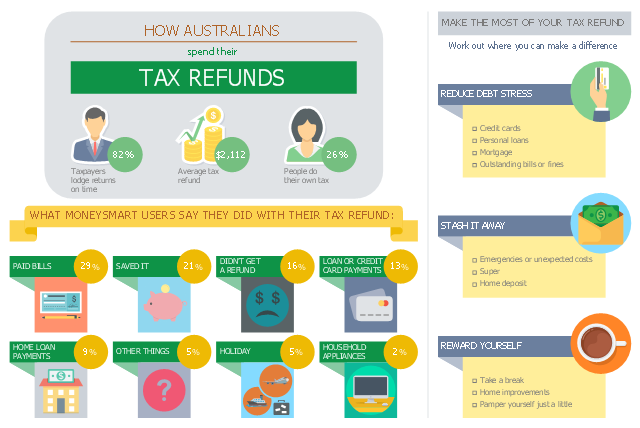
This business infographic sample shows the average tax refund and how people say they spent last year's tax refund. It was designed on the base of the infographic "How Australians spend their tax refunds" from the MoneySmart website of the Australian Securities and Investments Commission (ASIC).
[moneysmart.gov.au/ managing-your-money/ income-tax/ how-australians-spend-their-tax-refunds]
"A tax refund or tax rebate is a refund on taxes when the tax liability is less than the taxes paid. Taxpayers can often get a tax refund on their income tax if the tax they owe is less than the sum of the total amount of the withholding taxes and estimated taxes that they paid, plus the refundable tax credits that they claim. (Tax refunds are money given back at the end of the financial year.)" [Tax refund. Wikipedia]
The business infographic example "How Australians spend their tax refunds" was designed using ConceptDraw PRO diagramming and vector drawing software extended with the Business and Finance solution from Illustration area of ConceptDraw Solution Park.
Infographic
Infographic, title text block, square bullet, ship, ribbon text block, question mark, postal money order, money box, financial growth, employee male, employee female, drawing shapes, credit cards, credit card payment, computer, coffee break, cheque book, bulleted list, briefcase, bankruptcy, bank, airplane,

Audit Process Flowchart. Audit Flowchart

Audit Process Flowchart, Audit Flowchart - Audit Flowcharts solution for ConceptDraw DIAGRAM Solution Park provides the Audit Flowcharts library with wide variety of predesigned audit flowchart symbols, and also the set of templates and samples allowing you design your own audit flowchart or audit process flowchart in one moment. Simply use any of offered samples and change it for your needs, or fill the desired template.

Australia Map β€” States and Cities

Maps surround us everywhere in our life, study, work, traveling, they are widely used in geography, history, politics, economics, and many other fields of science and life activity. But designing of maps is usually complex and labor-intensive process. Now we have the possibility to make easier this process - ConceptDraw DIAGRAM diagramming and vector drawing software extended with Australia Map Solution from the Maps Area of ConceptDraw Solution Park will help us in easy drawing detailed Australia map.

SWOT analysis matrix diagram templates

Every day each company has challenge how to win the rally with competors. How to determine a path to the successful business? The one of best methodologies is SWOT Analysis. Abbreviation SWOT definition: S = strengths, W = weaknesses, O = opportunities, T = threats. Often named SWOT Matrix was introduced first at 1960s as examining tool of internal capabilities and possibilities of big companies. The SWOT analysis aim is to find critical factors influenced to company's business goal. You can begin a strategy to distinguish better competition value and to become successful in your market. Achiving best results form SWOT analysis can be reached when several employees will be involved at the process. Management, sales and customer service can all offer reasonable comprehension competitive situation.

Audit Procedures

Audit procedures are the specific tests and methods that auditor executes when gathering the evidence which are necessary for making an opinion on the financial statements of the firm. There are three types of audit procedures: data selection, reliability validation, relevance confirmation.
Thanks to the extensive drawing tools which provides the Audit Flowcharts solution from the Finance and Accounting area of ConceptDraw Solution Park, you can easy and effectively develop and realize various audit procedures.

crm software, crm tools, customer management software CRM Center Dashboard

crm software, crm tools, customer management software
The CRM Center Dashboard solution extends ConceptDraw DIAGRAM functionality with CRM software tools, large collection of CRM Charts live objects, CRM icons, CRM indicators, CRM maps and navigation elements, the set of professionally designed CRM samples and templates to help you construct your own CRM Dashboards and CRM Center Dashboards in a few minutes, to depict the current and actual data by connecting or refreshing the data source file. The customer management software ConceptDraw DIAGRAM makes you free to choose the style for your dashboard and to regulate the quantity of clipart on the diagram according to your taste.

Flowchart Symbols Accounting. Activity-based costing (ABC) flowchart

This flow chart example represent activity-based costing flowchart (ABC flowchart): resource-catagories, resource cost drivers, activities, activity cost drivers, cost objects, direct materials, direct labour. This sort of accounting flowcharts intended to explain how costs distributed between company units and departments. There is only way to clearly explain activity-based cost distribution - create cost diagram demonstrating cost distribution relations and logics. ConceptDraw DIAGRAM is special software with accounting flowchart symbols and flowchart stencils for effective drawing activity-based cost flowcharts (ABC-flowcharts).

block diagram, function blocks Block Diagrams

block diagram, function blocks
Block diagrams solution extends ConceptDraw DIAGRAM software with templates, samples and libraries of vector stencils for drawing the block diagrams.

audit flowchart, fiscal flowchart, audit steps, chart audits, chart auditor, auditing process, audit process flowchart, audit planning process Audit Flowcharts

audit flowchart, fiscal flowchart, audit steps, chart audits, chart auditor, auditing process, audit process flowchart, audit planning process
Audit flowcharts solution extends ConceptDraw DIAGRAM software with templates, samples and library of vector stencils for drawing the audit and fiscal flow charts.