HelpDesk
How to Create a Typography Infographic Using ConceptDraw PRO

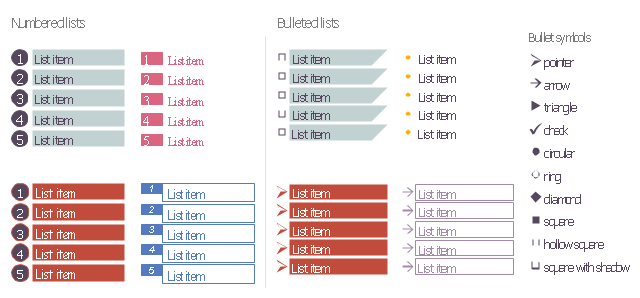
The vector stencils library "Education list blocks" contains 18 list block shapes: numbered list, bulleted list, bullets.
Use these list blocks to design your educational infograms.
"In typography, a bullet is a typographical symbol or glyph used to introduce items in a list. ...
The bullet symbol may take any of a variety of shapes, such as circular, square, diamond, arrow, etc. ...
Bullets are most often used in technical writing, reference works, notes and presentations. ...
Bulleted items – known as "bullet points" – may be short phrases, single sentences, or of paragraph length. Bulleted items are not usually terminated with a full stop if they are not complete sentences, although it is not rare to terminate every item except the last one with a semicolon, and terminate the last item with a full stop. It is correct to terminate a bullet point with a full stop if the text within that item consists of one 'full' sentence or more." [Bullet (typography). Wikipedia]
The shapes example "Design elements - Education list blocks" was created using the ConceptDraw PRO diagramming and vector drawing software extended with the Education Infographics solition from the area "Business Infographics" in ConceptDraw Solution Park.
Numbered lists, bulleted lists, bullets
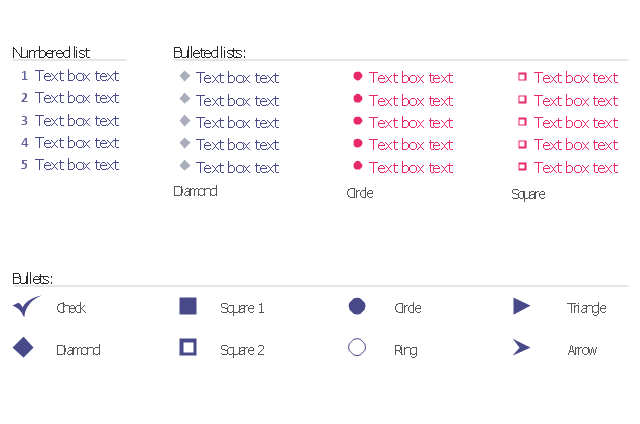
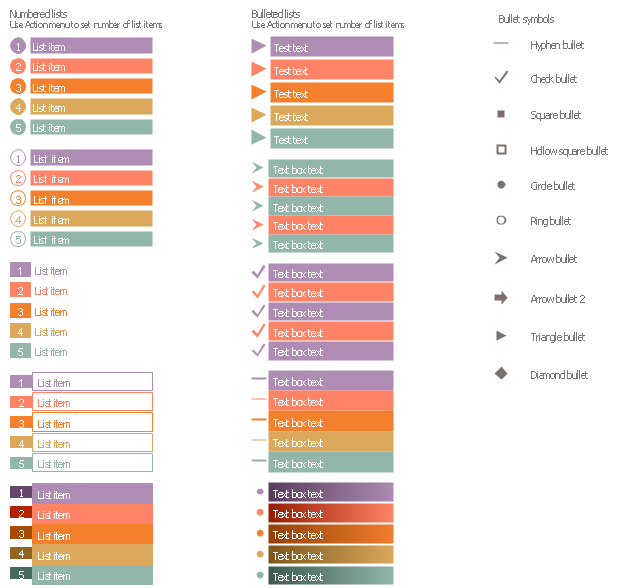
The vector stencils library "Bulleted and numbered lists" contains 12 elements of bulleted and numbered lists, and bullets for creating typography infographics.
"In typography, a bullet ( • ) is a typographical symbol or glyph used to introduce items in a list. ... The bullet symbol may take any of a variety of shapes, such as circular, square, diamond, arrow, etc., and typical word processor software offer a wide selection of shapes and colours. Several regular symbols are conventionally used in ASCII-only text or another environments where bullet characters are not available, such as * (asterisk), - (hyphen), . (period), and even o (lowercase O). Of course, when writing by hand, bullets may be drawn in any style. Historically, the index symbol was popular for similar uses." [Bullet (typography). Wikipedia]
The example "Design elements - Bulleted and numbered lists" was created using the ConceptDraw PRO diagramming and vector drawing software extended with the Typography Infographics solition from the area "What is infographics" in ConceptDraw Solution Park.
Typography infographics elements - Bulleted and numbered lists
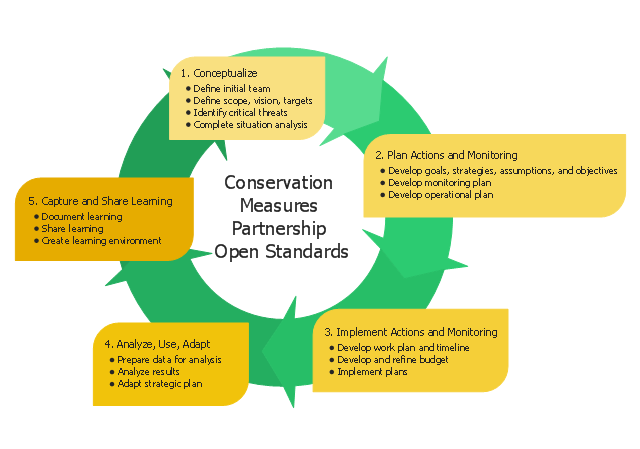
This circular arrows diagram sample shows five steps of the Conservation Measures Partnership (CMP) adaptive management cycle. It was designed on the base of the Wikimedia Commons file: CMP Cycle - 2008-02-20.jpg.
[commons.wikimedia.org/ wiki/ File:CMP_ Cycle_ -_ 2008-02-20.jpg]
"Adaptive management (AM), also known as adaptive resource management (ARM), is a structured, iterative process of robust decision making in the face of uncertainty, with an aim to reducing uncertainty over time via system monitoring. In this way, decision making simultaneously meets one or more resource management objectives and, either passively or actively, accrues information needed to improve future management. Adaptive management is a tool which should be used not only to change a system, but also to learn about the system. Because adaptive management is based on a learning process, it improves long-run management outcomes. The challenge in using the adaptive management approach lies in finding the correct balance between gaining knowledge to improve management in the future and achieving the best short-term outcome based on current knowledge.
Application to environmental projects and programs.
Open Standards for the Practice of Conservation lay out 5 main steps to an adaptive management project cycle." [Adaptive management. Wikipedia]
The diagram example "CMP adaptive management cycle" was created using the ConceptDraw PRO diagramming and vector drawing software extended with the Circular Arrows Diagrams solution from the area "What is a Diagram" of ConceptDraw Solution Park.
Circular arrows diagram
Used Solutions
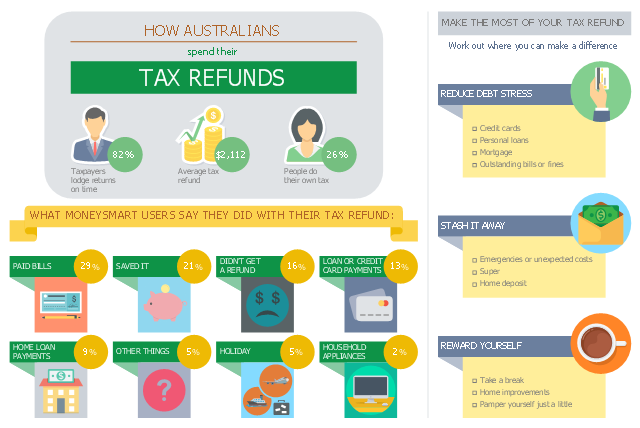
This business infographic sample shows the average tax refund and how people say they spent last year's tax refund. It was designed on the base of the infographic "How Australians spend their tax refunds" from the MoneySmart website of the Australian Securities and Investments Commission (ASIC).
[moneysmart.gov.au/ managing-your-money/ income-tax/ how-australians-spend-their-tax-refunds]
"A tax refund or tax rebate is a refund on taxes when the tax liability is less than the taxes paid. Taxpayers can often get a tax refund on their income tax if the tax they owe is less than the sum of the total amount of the withholding taxes and estimated taxes that they paid, plus the refundable tax credits that they claim. (Tax refunds are money given back at the end of the financial year.)" [Tax refund. Wikipedia]
The business infographic example "How Australians spend their tax refunds" was designed using ConceptDraw PRO diagramming and vector drawing software extended with the Business and Finance solution from Illustration area of ConceptDraw Solution Park.
Infographic
Infographic Generator

Typography Infographic Software

Typography Art

Basic Flowchart Symbols and Meaning


The vector stencils library "List blocks" contains 20 numbered list elements, bulleted list elements and bullet symbols for creating marketing infograms.
"In typography, a bullet ( • ) is a typographical symbol or glyph used to introduce items in a list. ...
The bullet symbol may take any of a variety of shapes, such as circular, square, diamond, arrow, etc., and typical word processor software offer a wide selection of shapes and colours. ...
Bullets are most often used in technical writing, reference works, notes and presentations." [Bullet (typography). Wikipedia]
The shapes example "Design elements - List blocks" was created using the ConceptDraw PRO diagramming and vector drawing software extended with the Marketing Infographics solition from the area "Business Infographics" in ConceptDraw Solution Park.
Lists
HelpDesk
How to Create PowerPoint® Text Slides from Mind Maps

The vector stencils library "Meter indicators" contains 29 Live Objects: speedometer gauge, dial, bullet graph, slider and level meter visual indicators.
The Live Objects designed to display actual measures of performance metrics and KPIs from external data source files.
Some of them also display comparative measures, and colored zones of qualitative ranges with legend.
Use it to draw business performance dashboards using the ConceptDraw PRO diagramming and vector drawing software .
"Digital dashboards may be laid out to track the flows inherent in the business processes that they monitor. Graphically, users may see the high-level processes and then drill down into low level data. This level of detail is often buried deep within the corporate enterprise and otherwise unavailable to the senior executives. ...
Specialized dashboards may track all corporate functions. Examples include human resources, recruiting, sales, operations, security, information technology, project management, customer relationship management and many more departmental dashboards. ...
Like a car's dashboard (or control panel), a software dashboard provides decision makers with the input necessary to "drive" the business. Thus, a graphical user interface may be designed to display summaries, graphics (e.g., bar charts, pie charts, bullet graphs, "sparklines," etc.), and gauges (with colors similar to traffic lights) in a portal-like framework to highlight important information. ...
Digital dashboards allow managers to monitor the contribution of the various departments in their organization. To gauge exactly how well an organization is performing overall, digital dashboards allow you to capture and report specific data points from each department within the organization, thus providing a "snapshot" of performance." [Dashboard (management information systems). Wikipedia]
The example "Design elements - Meter indicators" is included in the Meter Dashboard solution from the area "What is a Dashboard" of ConceptDraw Solution Park.
Visual indicators

 Website Wireframe
The innovative Website Wireframe solution enhances the ConceptDraw PRO v10 functionality with newest wireframe tools, libraries with variety of predesigned icons, symbols, buttons, graphics, forms, boxes, and many other vector elements, templates and professionally designed samples, which make it the best wireframing software. Website Wireframe solution gives you significant advantages when designing and maintaining websites, creating skeletal and content-free depictions of website structure, making website prototypes and planning the content arrangement before committing to design, also speeds up the processes of sketching, producing and sharing wireframe examples of website style and interface design.
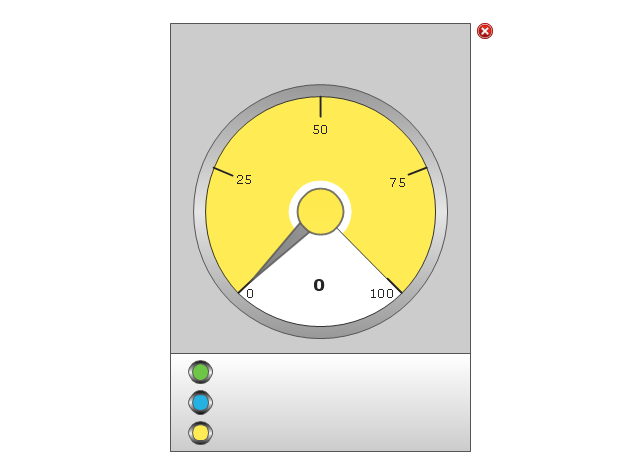
The vector stencils library "Meter indicators 2" (for dark background) contains 29 Live Objects: speedometer gauge, dial, bullet, slider and level meter visual indicators.
The Live Objects designed to display actual measures of performance metrics from external data source files. Some of them also display comparative measures, and colored zones of qualitative ranges with legend.
Use this library to create visual dashboards in the ConceptDraw PRO diagramming and vector drawing software extended with the Meter Dashboard solution from the area "What is a Dashboard" of ConceptDraw Solution Park.
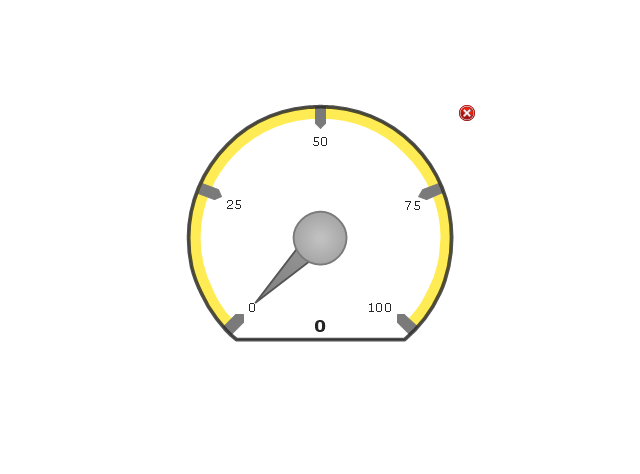
Speedometer Gauge 1

Speedometer Gauge 2
Speedometer Gauge 3
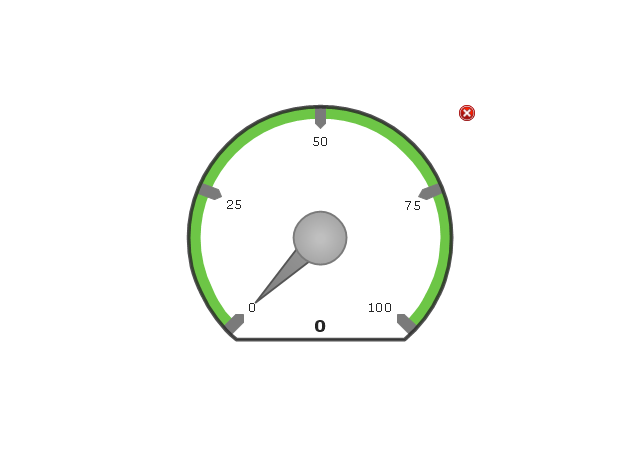
Speedometer Gauge 4
Dial 1
Dial 2
Bullet 1

Bullet 2
Bullet 3
Bullet 4

Bullet 5

Bullet 6

Directed Bullet 1
Directed Bullet 2

Slider Horizontal 1
Slider Horizontal 2
Slider Horizontal 3
Slider Horizontal 4
Slider Vertical 1
Slider Vertical 2
Slider Horizontal 5
Slider Horizontal 6
Slider Horizontal 7
Slider Vertical 3
Level Meter 1
Level Meter 2
Level Meter 3
Level Meter 4
Level Meter 5
 Meter Dashboard
Meter dashboard solution extends ConceptDraw PRO software with templates, samples and vector stencils library with meter indicators for drawing visual dashboards showing quantitative data.
- Arrow Bullet Png
- Bullet Symbols Png File
- List Bullet Png
- Bullet Points Png
- Bullet Icon Png
- Arrow Bullet Vector Png
- Arrow Bullet Icon Png
- Bullet Points Symbols In Png
- Bullet Symbol Png
- Special Arrow Bullet Icon Png
- Arrow Bullet Point Png
- Word Bullet Vector Png
- Design elements - Bulleted and numbered lists | Design elements ...
- Process Flowchart | Design elements - Bulleted and numbered lists ...
- Plc Icon Png
- Design elements - Bulleted and numbered lists | Design elements ...
- HR arrows - Vector stencils library | Png Bullet Point Ribbon
- Types of summaries - Slide sample | Design elements - Bulleted and ...
- School Text Background Vector Png
- Png List Elements