Chart Maker for Presentations

This ring chart sample was redesigned from the Wikipedia file: Virtuous circle in management.svg.
"An example of the use of a virtuous circle in management."
[en.wikipedia.org/ wiki/ File:Virtuous_ circle_ in_ management.svg]
"A virtuous circle and a vicious circle (also referred to as virtuous cycle and vicious cycle) are economic terms. They refer to a complex chain of events that reinforces itself through a feedback loop. A virtuous circle has favorable results, while a vicious circle has detrimental results.
Both circles are complexes of events with no tendency towards equilibrium (at least in the short run). Both systems of events have feedback loops in which each iteration of the cycle reinforces the previous one (positive feedback). These cycles will continue in the direction of their momentum until an external factor intervenes and breaks the cycle. The prefix "hyper-" is sometimes used to describe these cycles if they are extreme. The best-known example of a vicious circle is hyperinflation. ...
Example in management.
Virtuous circle.
An employer's investment in his employees’ ability to provide superior service to customers can be seen as a virtuous circle. Effort spent in selecting and training employees and creating a corporate culture in which they are empowered can lead to increased employee satisfaction and employee competence. This can result in superior service delivery and customer satisfaction. This in turn will create customer loyalty, improved sales levels, and higher profit margins. Some of these profits can be reinvested in employee development, thereby initiating another iteration of a virtuous cycle." [en.wikipedia.org/ wiki/ Virtuous_ circle_ and_ vicious_ circle]
The ring chart example "Virtuous circle (management)" was created using the ConceptDraw PRO diagramming and vector drawing software extended with the Target and Circular Diagrams solution from the Marketing area of ConceptDraw Solution Park.
www.conceptdraw.com/ solution-park/ marketing-target-and-circular-diagrams
Ring chart
---ring-chart.png--diagram-flowchart-example.png)
The vector stencils library "Concept maps" contains 16 geometrical shapes.
Use it to create your concept maps, mindmaps, idea maps, tree diagrams, omega maps, cluster diagrams and spider diagrams.
The symbols example "Concept maps - Vector stencils library" was created using the ConceptDraw PRO diagramming and vector drawing software extended with the Concept Maps solution from the area "What is a Diagram" of ConceptDraw Solution Park.
Rectangle

Rounded rectangle

Stadium

Oval
Diamond

Parallelogram

Circle

Star

Hexagon

Cloud

Starburst

Arrow
Envelope

Note

Callout

Table

Pie Chart Word Template. Pie Chart Examples

Chart Software for Better Presentations

 Audit Flowcharts
Audit flowcharts solution extends ConceptDraw DIAGRAM software with templates, samples and library of vector stencils for drawing the audit and fiscal flow charts.
Hiring Process

Scatter Chart Examples

Blank Scatter Plot
GUI Prototyping with ConceptDraw DIAGRAM
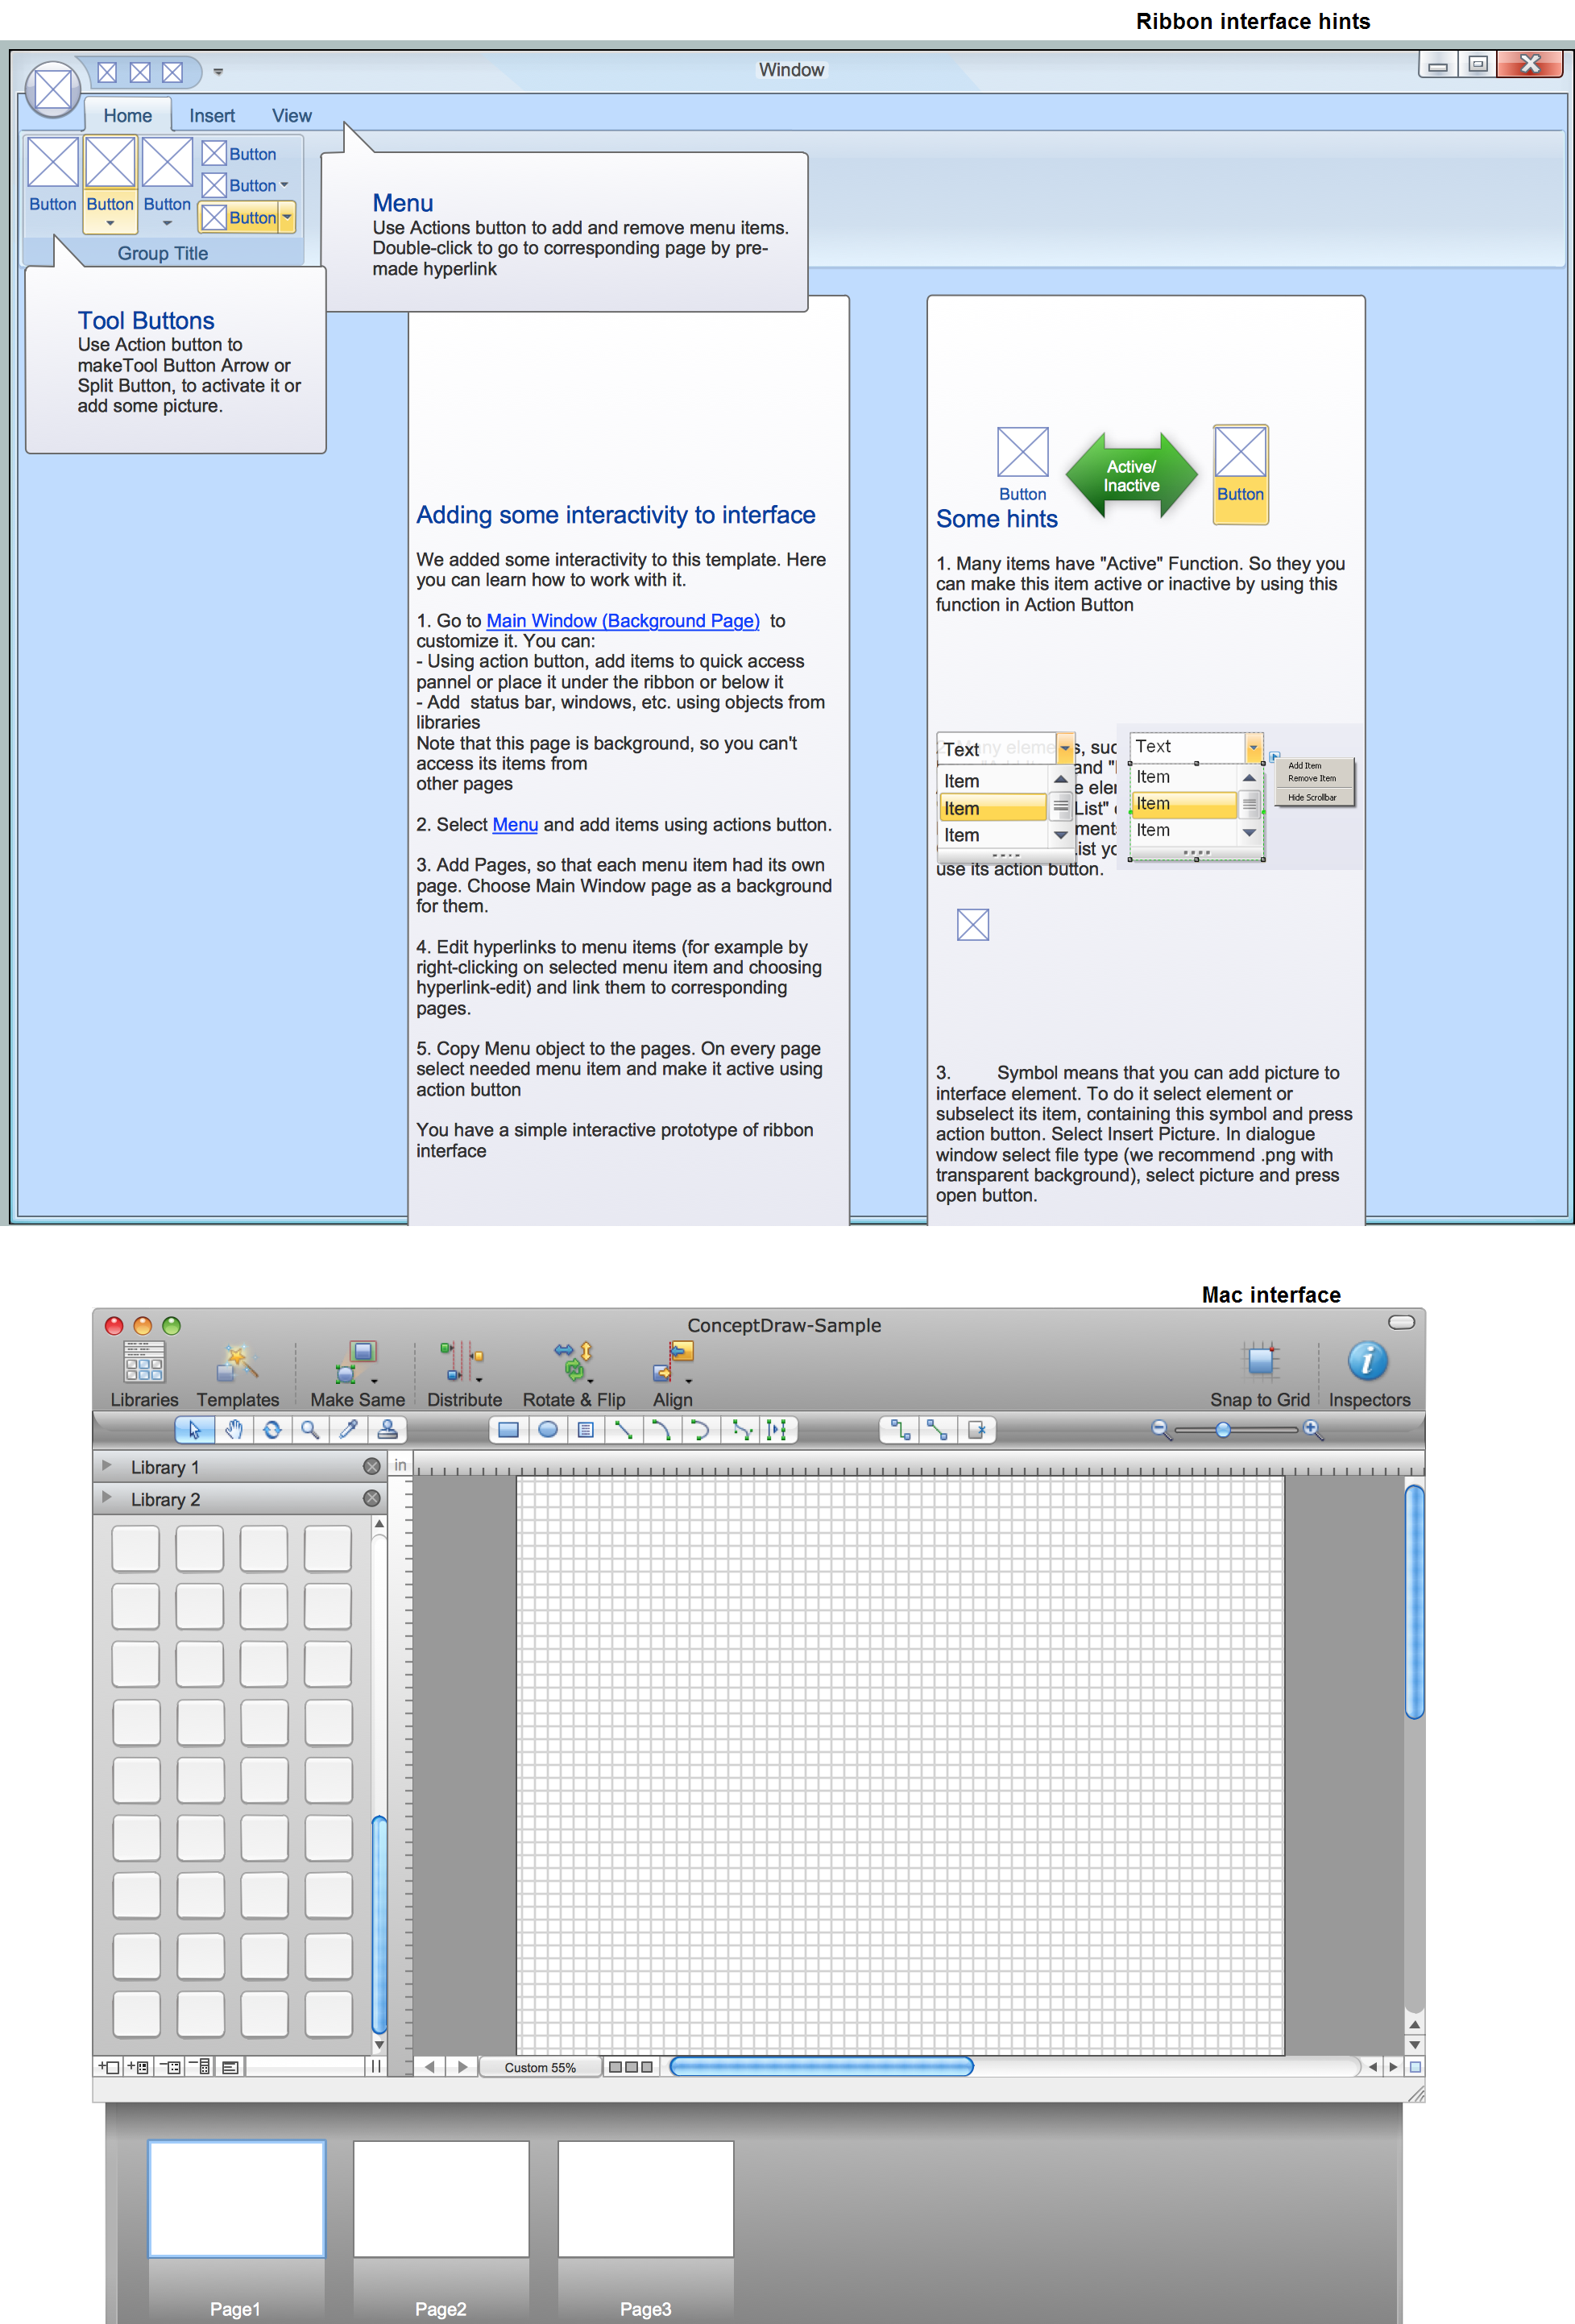
MS Visio Look a Like Diagrams

UML Diagram Visio

ConceptDraw DIAGRAM Compatibility with MS Visio

Pie Chart

Project — Assigning Resources


- Spider Chart Template | Six Markets Model Chart | Entity ...
- Vicious circle - Crystal diagram | Geo Map - Europe - France ...
- Circle Diagrams | Design elements - Pie charts | Project ...
- Types of Flowcharts | 2 Circle Venn Diagram . Venn Diagram ...
- Physics Diagrams | Astronomy Symbols | 3 Circle Venn. Venn ...
- Percentage Pie Chart . Pie Chart Examples | How to Draw the ...
- Circle In Clouds Png
- Vicious circle - Crystal diagram | Virtuous circle (macroeconomics ...
- Diagram Of Circle Hexagon And Rectangle In A Stencil
- Marketing Organization Chart | Marketing Infographics | How To ...
- Circle Diagrams | Pie Chart Examples and Templates | Chart Maker ...
- Circle Chart Marketing
- Circle Chart Maker
- Percentage Spider Chart | Pie Chart Examples and Templates ...
- Process Flow Diagram | Pie Chart Examples and Templates | Polar ...
- Organizational Chart Template | Flowchart Software | Context ...
- Chart Software for Better Presentations | Rainfall Bar Chart | 3 Circle ...
- Spider Diagram Of Social Media
- Block diagram - Porter's five forces model | Competitor Analysis ...
- Scatter Chart Examples | Target market - Onion diagram | Target ...