HelpDesk
How To Make Visio Circle-Spoke Diagram

HelpDesk
How To Create Cause and Effect (Fishbone) Diagram in MS Visio
 Diagram in MS Visio")
HelpDesk
How to Draw a Circular Arrows Diagram

Marketing and Sales Organization chart. Organization chart Example

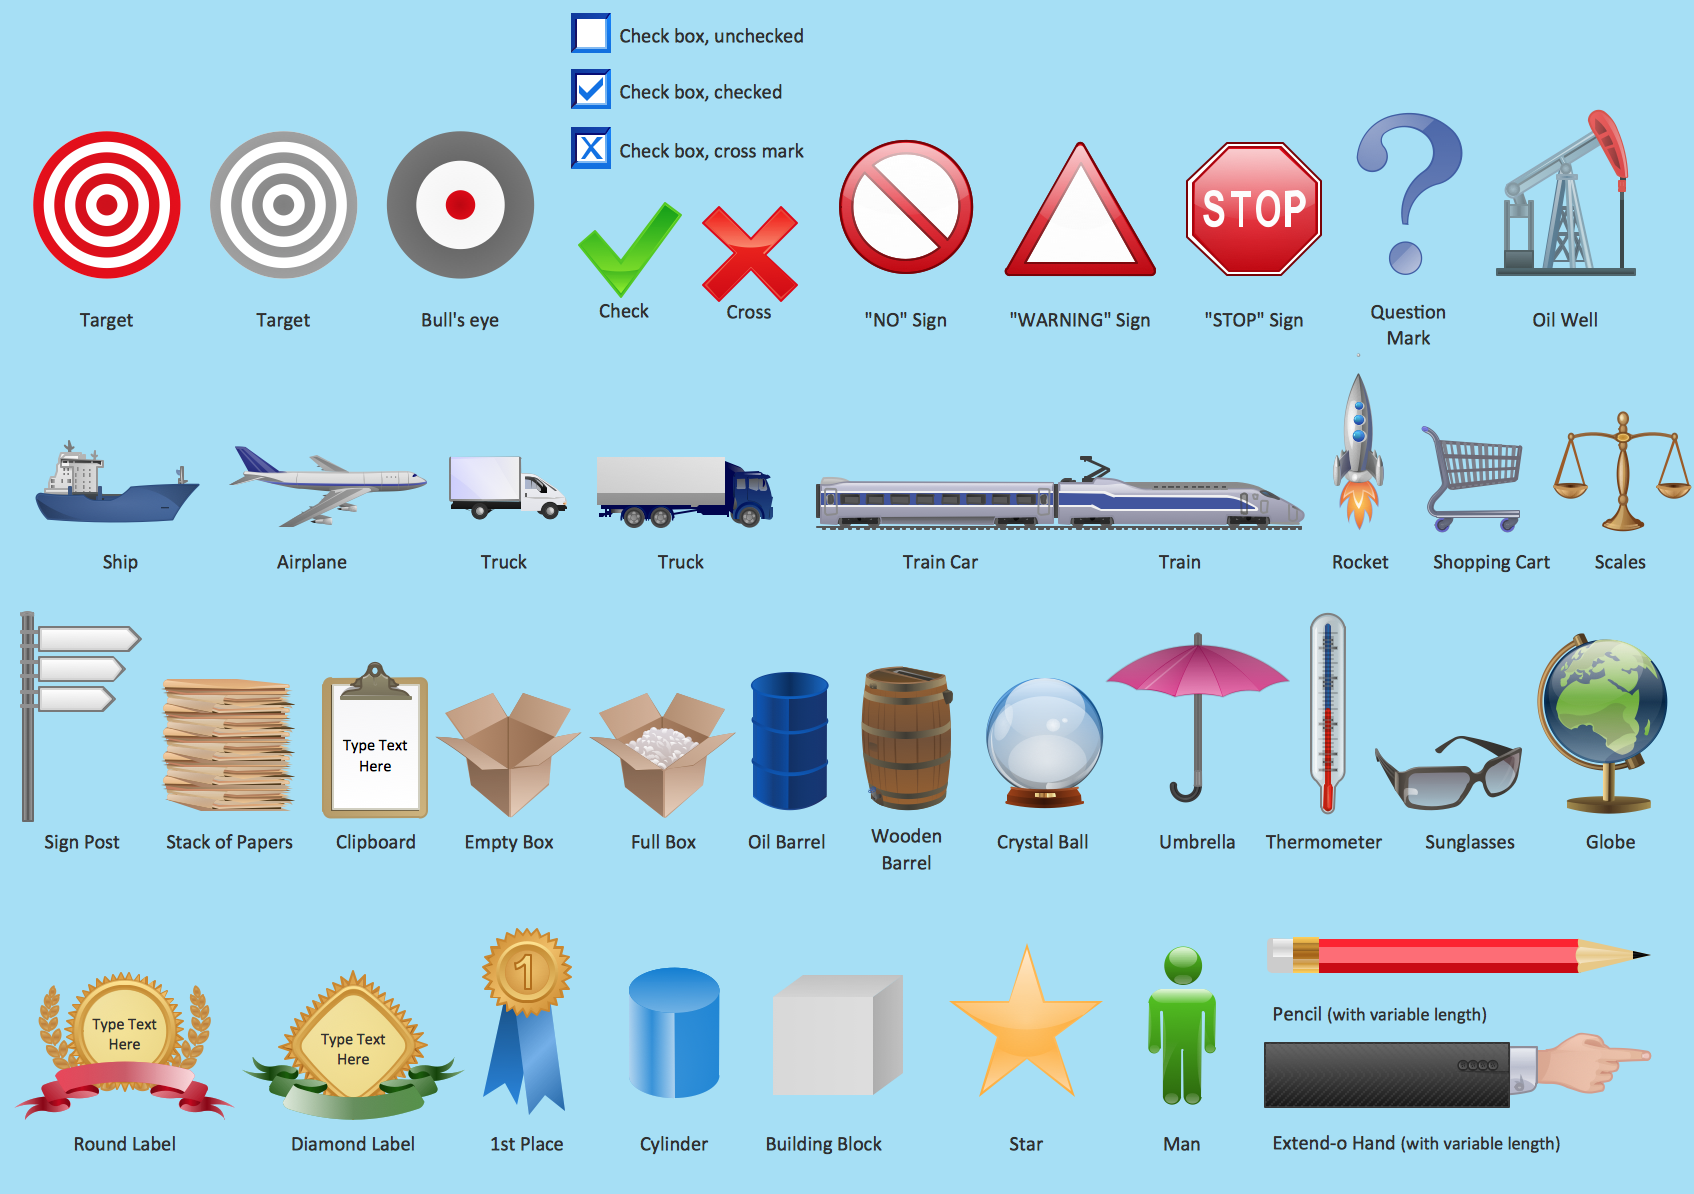
Marketing - Design Elements
Flowchart design. Flowchart symbols, shapes, stencils and icons


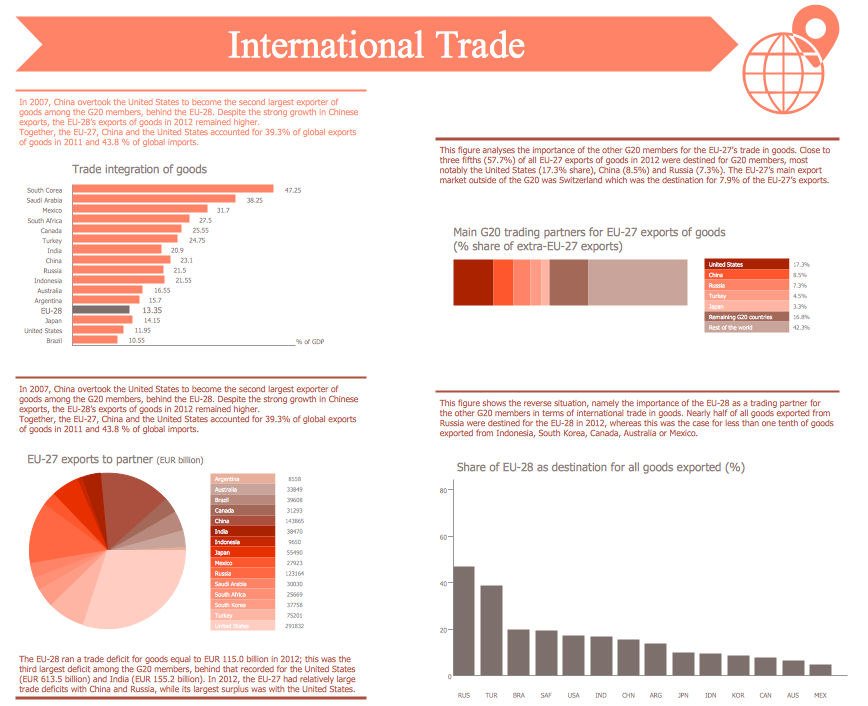
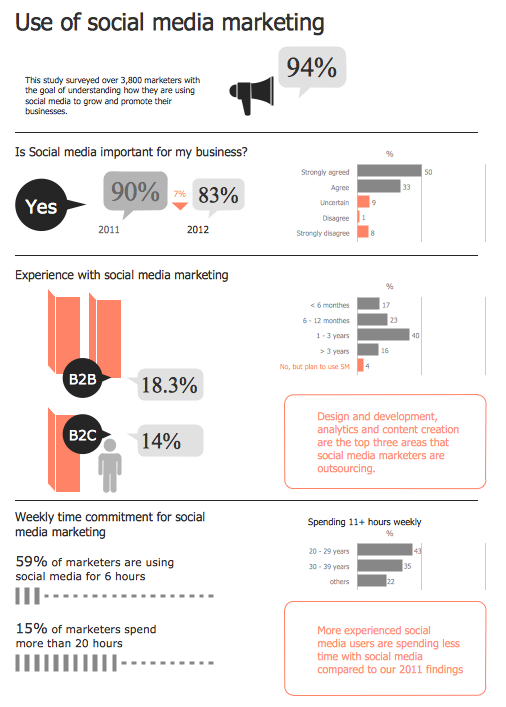
Marketing Infographics
Social Media Marketing Infographic
HelpDesk
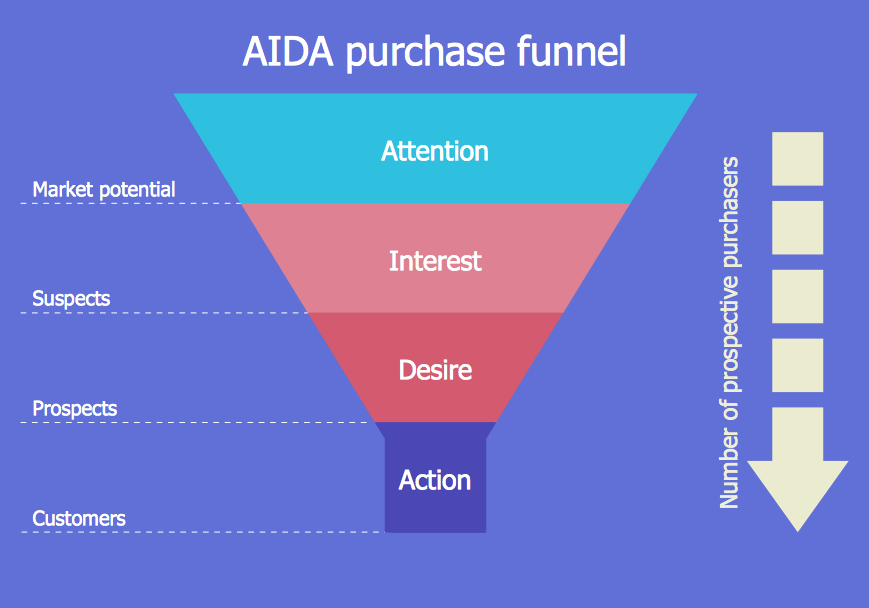
How to Create a Funnel Diagram
Spider Chart Template

- Basic Flowchart Symbols and Meaning | Marketing - Vector stencils ...
- Instruments - Vector stencils library | Marketing - Vector stencils ...
- Circular Diagram Visio Templates
- Visio Stencil Train
- Pro Circle Stencil
- How To Create a Visio Circle-Spoke Diagram Using ConceptDraw ...
- Visio Shapes Hvac Equipment
- Value Chain Visio Template
- Fault Tree Diagram | Marketing Charts | IDEF0 Visio | Decision Tree ...
- Funnel Shape In Visio