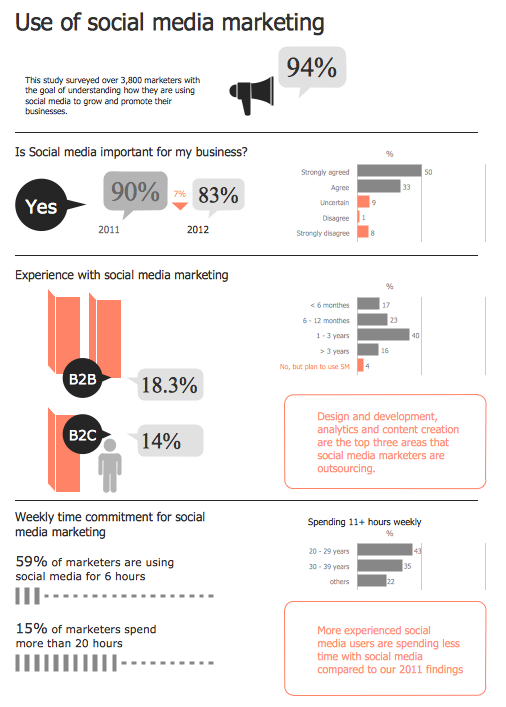
Example 1. Social Media Marketing Infographic - Use of social media marketing
Marketing Infographics Solution provides large collection of marketing infographics samples and templates to be filled in. When you design the social media marketing infographic, you can use as the base one of the offered templates or samples from ConceptDraw STORE, or create it de novo simply dragging the objects from the Marketing Infographics Solution libraries and adding the text.

Example 2. Marketing Infographics Solution in ConceptDraw STORE
11 libraries of Marketing Infographics Solution with large quantity of ready-to-use vector stencils will help you change our examples according to your needs in minutes.
These libraries contain 327 vector objects for easy drawing marketing infographics.

Example 3. Social Media Marketing Infographic - A single currency to boost the Single Market
The samples you see on this page were created in ConceptDraw DIAGRAM using the vector objects from the Marketing Infographics Solution libraries. These samples demonstrate the solution's capabilities and the professional results you can achieve. An experienced user spent 15 minutes creating every of these samples.
Use Marketing Infographics solution to design your own Social Media Marketing Infographic of any complexity quick and easy.
All source documents are vector graphic documents. They are available for reviewing, modifying, or converting to a variety of formats (PDF file, MS PowerPoint, MS Visio, and many other graphic formats) from the ConceptDraw STORE. The Marketing Infographics Solution is available for ConceptDraw DIAGRAM users.
FIVE RELATED HOW TO's:
Marketing Infographics are very popular for visual graphical representation of various marketing information, data, and different knowledge. They allow you easily represent the complex information in simple, understandable form. ConceptDraw DIAGRAM diagramming and vector drawing software extended with Marketing Infographics Solution from the Business Infographics Area affords you the easiest and fastest way for designing professional looking Marketing Infographics 2014.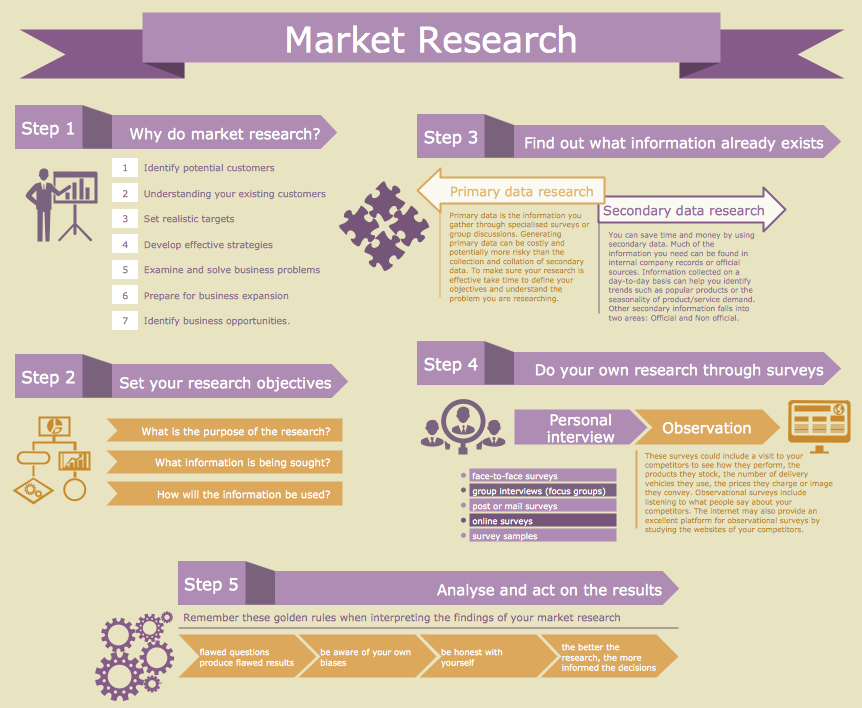
Picture: Marketing Infographics 2014
Related Solution:
Mind map that details the various keyboard shortcuts and mouse actions that can be utilized in ConceptDraw MINDMAP.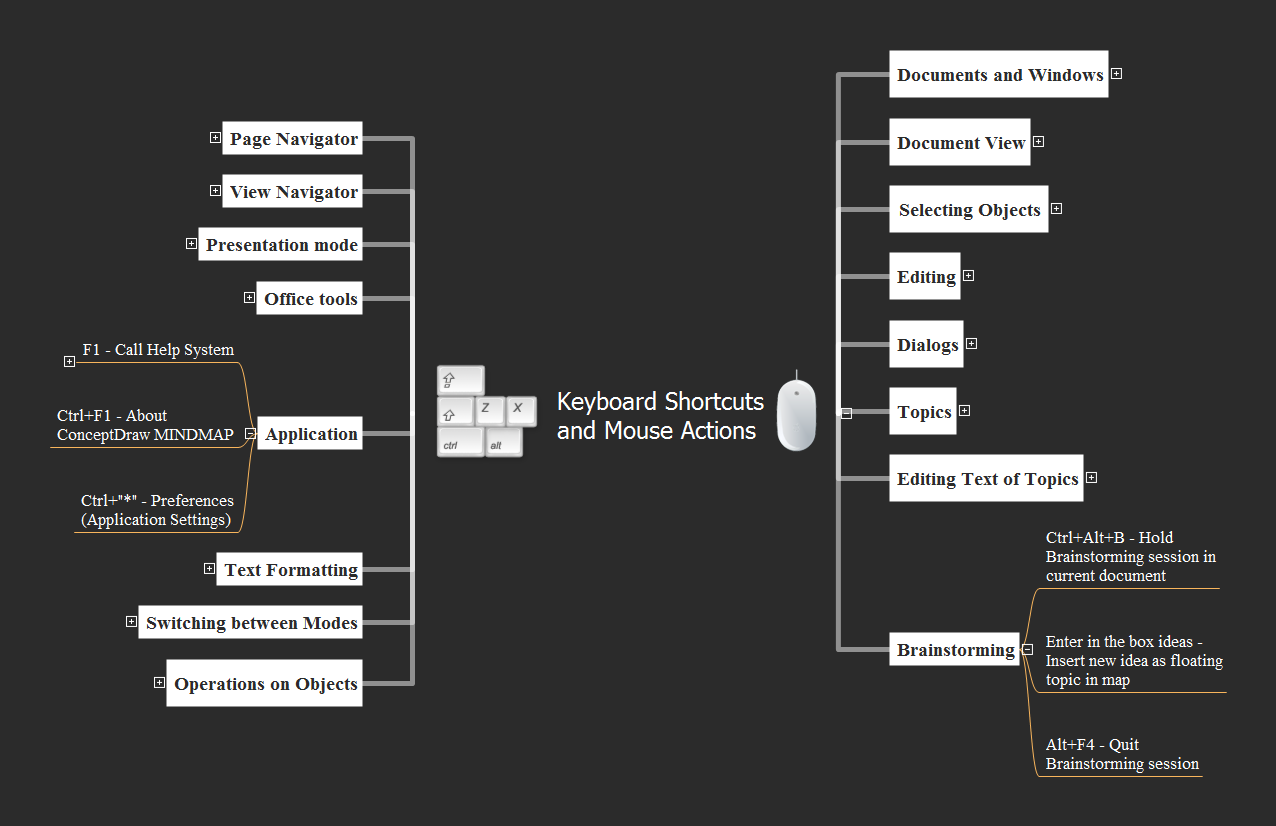
Picture: Keyboard Shortcuts and Mouse Actions
Related Solution:
There are many tools to manage a process or to illustrate an algorithm or a workflow. Flowcharting is one of those tools. However, it may be difficult to show complex processes that require multiple attributes or several people in a simple flowchart, so a cross-functional flowchart would be a solution for that situation. To create such flowchart, group processes and steps to labeled rows or columns, and divide those groups with horizontal or vertical parallel lines. It is worth mentioning that there are different types of cross-functional flowcharts, like opportunity or deployment flowchart.
This diagram shows a cross-functional flowchart that was made for a trading process. It contains 14 processes, distributed through 5 lines depicting the participants who interact with the process. Also there are connectors that show the data flow of information between processes. The cross-functional flowchart displays a detailed model of the trading process, as well as all participants in the process and how they interact with each other. The lines in the flowchart indicates the position, department and role of the trading process participants.
Picture: Cross-Functional Flowchart
Related Solution:
Funnel diagram can be also known as a funnel chart being similar to a stacked percent bar chart. This drawing is a type of chart that can be often used in order to represent the stages in some sales process. It can be also used for showing the amount of potential revenue for each of the described stages.
In order to make a funnel diagram, the Funnel Diagrams solution can be used while working in the ConceptDraw DIAGRAM diagramming and drawing software. Having the pre-made design elements as well as the examples of funnel diagrams, the Funnel Diagrams solution allows any ConceptDraw DIAGRAM user to make their own unique as well as professionally-looking drawings.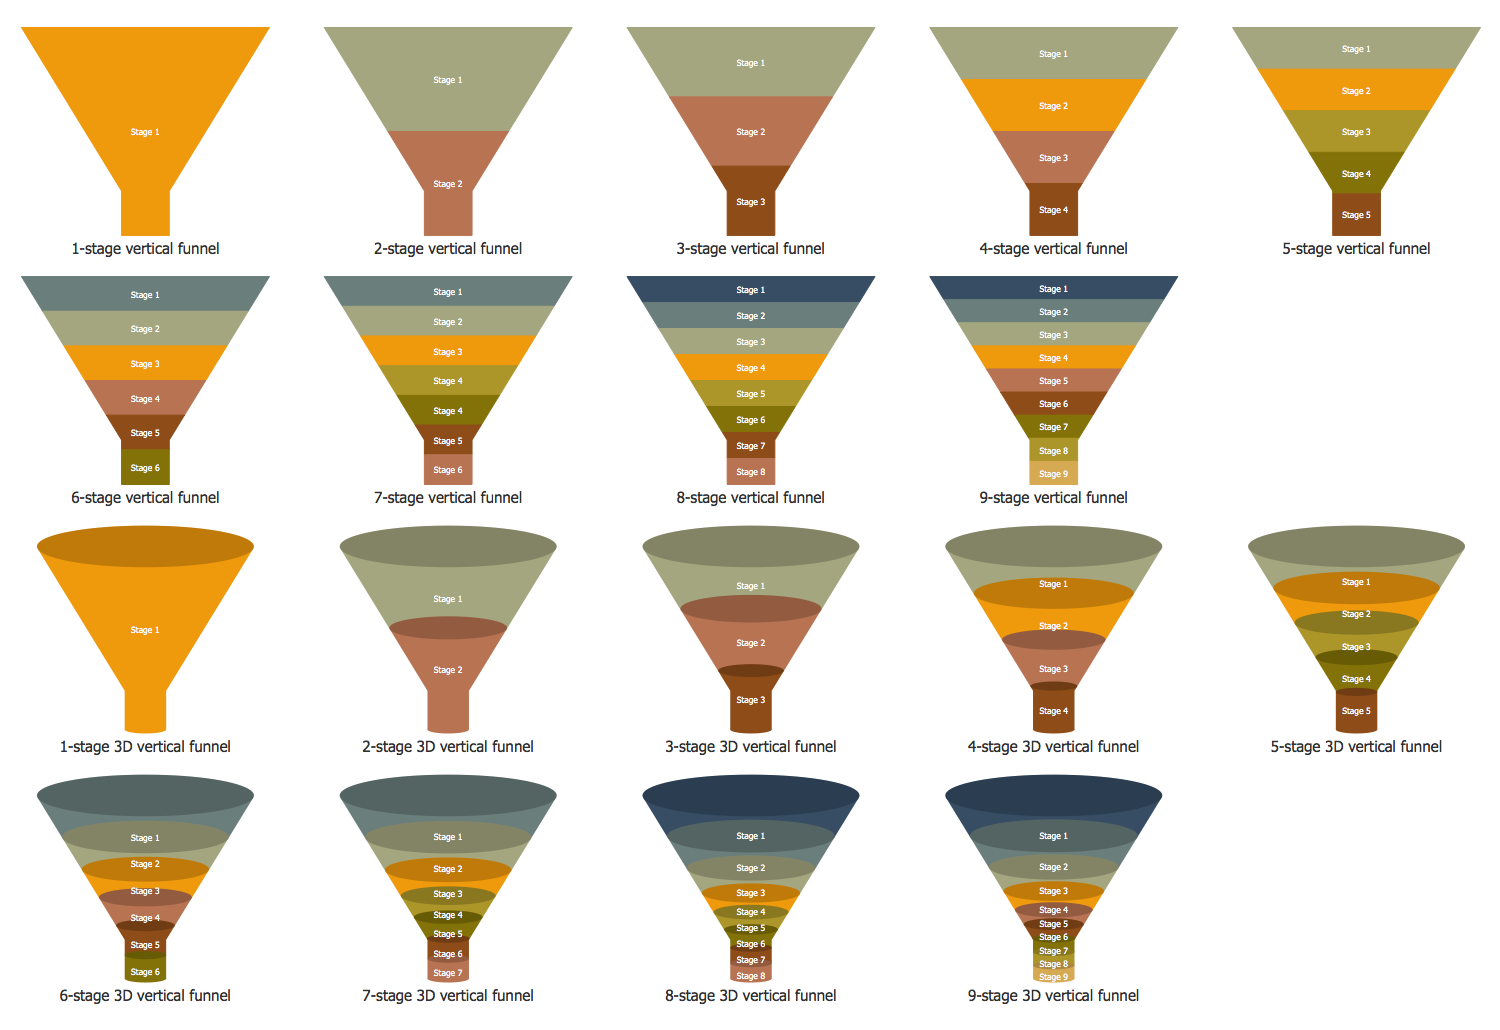
Picture: Funnel Diagram
ConceptDraw DIAGRAM is a professional software for creating great looking flowcharts. The samples included in this set of software allows users to draw any type of flowchart.
Picture: Flowchart Process Example
Related Solution:


.png "Marketing Maps EU Library")
.png "Marketing Maps G-20 Library")
.png "Marketing Maps World Map Library")


