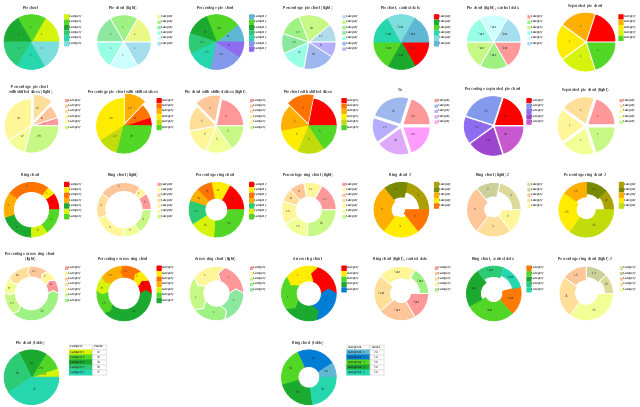
The vector stencils library Pie charts contains 30 templates you can use to add pie and donut charts in your business documents, presentation slides and infographics using the ConceptDraw PRO diagramming and vector drawing software.
"A pie chart (or a circle graph) is a circular chart divided into sectors, illustrating numerical proportion. In a pie chart, the arc length of each sector (and consequently its central angle and area), is proportional to the quantity it represents. While it is named for its resemblance to a pie which has been sliced, there are variations on the way it can be presented. ...
Pie charts are very widely used in the business world and the mass media. However, they have been criticized, and many experts recommend avoiding them, pointing out that research has shown it is difficult to compare different sections of a given pie chart, or to compare data across different pie charts. Pie charts can be replaced in most cases by other plots such as the bar chart. ...
However, if the goal is to compare a given category (a slice of the pie) with the total (the whole pie) in a single chart and the multiple is close to 25 or 50 percent, then a pie chart can often be more effective than a bar graph. ...
A doughnut chart (also spelled donut) is functionally identical to a pie chart, with the exception of a blank center and the ability to support multiple statistics as one." [Pie chart. Wikipedia]
The example "Design elements - Pie charts" is included in the Pie Charts solution of the Graphs and Charts area in ConceptDraw Solution Park.
Templates
Export from ConceptDraw MINDMAP to PowerPoint® Presentation


to MS PowerPoint
Project management - Design Elements

Waterfall Bar Chart

 Bar Graphs
The Bar Graphs solution enhances ConceptDraw PRO v10 functionality with templates, numerous professional-looking samples, and a library of vector stencils for drawing different types of Bar Graphs, such as Simple Bar Graph, Double Bar Graph, Divided Bar Graph, Horizontal Bar Graph, Vertical Bar Graph, and Column Bar Chart.
 Healthcare Management Workflow Diagrams
Healthcare Management Workflow Diagrams solution contains large set of colorful samples and libraries with predesigned vector pictograms and symbols of health, healthcare equipment, medical instruments, pharmaceutical tools, transport, medication, departments of healthcare organizations, the medical icons of people and human anatomy, as well as the predesigned flowchart objects, connectors and arrows, which make it the best for designing clear and comprehensive Mediсal Workflow Diagrams and Block Diagrams, Healthcare Management Flowcharts and Infographics, Healthcare Workflow Diagram, for depicting the healthcare workflow and clinical workflows in healthcare, for making the workflow analysis healthcare and healthcare workflow management.
Funnel Chart

 Pie Charts
Pie Charts are extensively used in statistics and business for explaining data and work results, in mass media for comparison (i.e. to visualize the percentage for the parts of one total), and in many other fields. The Pie Charts solution for ConceptDraw PRO v10 offers powerful drawing tools, varied templates, samples, and a library of vector stencils for simple construction and design of Pie Charts, Donut Chart, and Pie Graph Worksheets.
 Education Package
Education Package is a comprehensive set of multifarious graphical solutions from ConceptDraw Solution Park, collected together in help to ConceptDraw PRO users working in a field of science, education and training, which is aimed at improving the quality of education and helping to design with ease variety of interesting and colorful educational materials, diagrams, charts and maps. Use it to present the information and knowledge in an interesting, clear, structured and simple form to achieve a success in education and pedagogy, to maintain the interest of students and pupils throughout the whole learning process, at the lectures, lessons and even during independent work with additional materials, to contribute to better perception of scientific information by listeners during the conferences and reports.
Chart Examples

- Atmosphere air composition | Percentage Pie Chart . Pie Chart ...
- HVAC Plans | Pie Charts | Bar Diagram Of Elements Of Air
- Draw A Pie Chart Showing Different Gases And Their Percentage In
- Aircraft - Design Elements | Hiring Process | Pie Chart Examples and ...
- Atmosphere air composition | Percentage Pie Chart . Pie Chart ...
- Chart Maker for Presentations | Spider Chart Template | Percentage ...
- Spider Chart Template | Percentage Spider Chart | Chart Maker for ...
- Percent Shown As A Pie Chart
- Rainfall Bar Chart | Percentage Pie Chart . Pie Chart Examples ...
- Atmosphere air composition | Design elements - Composition charts ...