Funnel Chart
Funnel chart is known to be one of the types of charts that can be used for representing different stages in some sales process. It may show the potential revenue for each of such stages. This particular type of chart can also be useful in identifying all the potential problem areas. Managing to do so may be achieved within any organization’s sales process. Any funnel chart is known to be similar to a stacked percent bar chart as they look alike.
Displaying the values as progressively decreasing proportions amounting to 100 percent, a funnel chart may be created in the ConceptDraw DIAGRAM diagramming and vector drawing software. The size of the area of the chart itself is usually determined by the series value as a percentage of the total of all of the values. Any funnel chart consists of its higher part (known as “head” or “base”) and its lower part (known as “neck”).
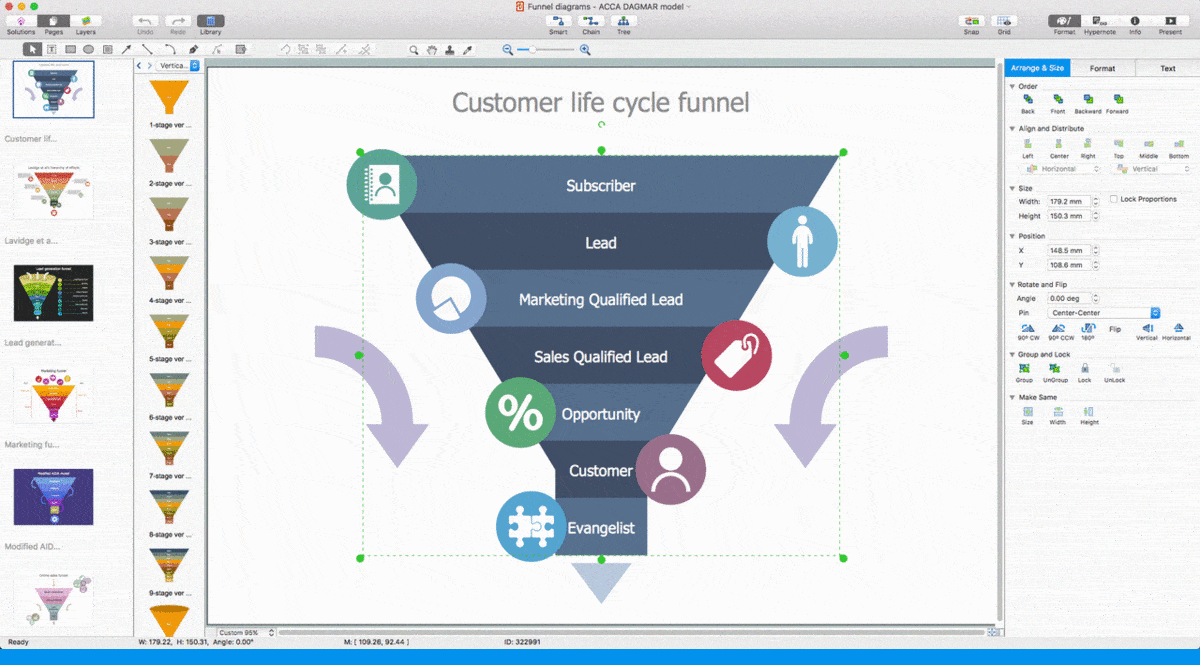
An example of a funnel chart may be the one starting with the sales leads on top. The qualified leads may be mentioned lower and the hot and closed deals later. Any business is known to be at a risk of losing a few potential deals at each of the steps in the sales process. This may be represented by the narrowing sections which go all the way down on the drawing.
As you move from the top section to the bottom section, you go from the widest one to the narrowest. It allows the executives to see whether the sales team is effective in turning a sales lead into a so-called “closed deal”. A sales funnel chart can also be used for quick communication introducing the new members of the sales team or other interested parties into organization's sales process.
A funnel chart can be also used for displaying the needed websites visitor trends. In this case, it will display a wide area at the top, indicating visitor page hits to the homepage. All the other areas will be proportionally smaller, such as the downloads or those people who are interested in buying the product.
Funnel Chart in ConceptDraw DIAGRAM
Another instance may be the order fulfillment funnel chart where the initiated orders are on top and the orders that delivered to the satisfied customers are down to the bottom. It may show the quantity of those who are still in the process as well as the percentage of those which were returned and cancelled.
Ideally, the funnel chart needs show a process that starts at 100%. It should also end with a lower percentage, so it becomes clear to see in what stages the fall out happens and at what rate it happens. In case the chart is combined with research data, then the funnel chart illustrates where the biggest bottlenecks are in the whole process. In this case, the quantified measurements of how many items are lost at each of the steps of the sales or order fulfillment process are mentioned.
Making a chart such as a funnel one may be a challenge for those who do not have as much experience in creating it. For this reason, as well as for time-saving sake, the Funnel Diagrams solution was introduced in order to simplify any ConceptDraw DIAGRAM user’s process of creating the funnel charts. This Funnel Diagrams solution includes the pre-made design elements in the stencil libraries and the templates of such charts.
Thus, there are 145 design elements in total from 5 stencil libraries in the Funnel Diagrams solution. The first library is “Funnel Icons”. It includes the vector representations of address book, award medal, badge, banknotes, bar chart, box, brain, calculator, certificate, clock, cloud, coins, database, desktop computer, document, dollar sign, eMail, euro sign, folder, form, 3 different icons of gears, gift, globe, handshake, headphones, laptop computer, light bulb, line chart, mail, message, monitor, movie, music, newspaper, notebook and pencil, music notes, office files, pencil, phone call, percent, photo camera, portfolio, pie chart, presentation, smartphone, puzzle, speech balloon, sms, speech balloons, star, tag, stickman, target, users, user, umbrella, video clip, number one, two, three, four, five six, seven and nine.
Next, “Horizontal Funnels” library includes such pre-made images of the funnels as 1-stage 2D horizontal one, 2-stage 2D horizontal one, 3-stage 2D horizontal one, 4-stage 2D horizontal one, 5-stage 2D horizontal one, 6-stage 2D horizontal one, 7-stage 2D horizontal one, 8-stage 2D horizontal one and 9-stage 2D horizontal funnel.
“Funnel Arrows” library includes the arrows pointing to the right, left, up and down, dotted arrows pointing to the right, left, up and down, ark arrows pointing to the up right, right down, right up and down right, corners arrows pointing to the up right, right down, right up and down right and elbow arrows pointing to the right up, up right, right down and down right.

Funnel Chart Design Elements
There are also other libraries that may be used by all the ConceptDraw DIAGRAM users in order to create the smart-looking as well as professionally-looking funnel charts. Having all the mentioned tools would make it simpler to draw any needed funnel diagram even if you have no experience in making it.


