Flowchart design. Flowchart symbols, shapes, stencils and icons


Basic Flowchart Symbols and Meaning


This interactive voice response (IVR) diagram sample shows the Scheme of VoIP call with SIM box and gateway. It was designed on the base of the Wikimedia Commons file: Scheme of VoIP call with Sim box.png. [commons.wikimedia.org/ wiki/ File:Scheme_ of_ VoIP_ call_ with_ Sim_ box.png]
This file is licensed under the Creative Commons Attribution-Share Alike 4.0 International license. [creativecommons.org/ licenses/ by-sa/ 4.0/ deed.en]
"A SIM box (also called a SIM bank) is device used as part of a VoIP gateway installation. It contains a number of SIM cards, which are linked to the gateway but housed and stored separately from it. A SIM box can have SIM cards of different mobile operators installed, permitting it to operate with several GSM gateways located in different places." [SIM box. Wikipedia]
The IVR diagram example "VoIP call with SIM box and gateway" was designed using ConceptDraw PRO diagramming and vector drawing software extended with the Interactive Voice Response Diagrams solution from the Computer and Networks area of ConceptDraw Solution Park.
IVR diagram

Entity Relationship Diagram - ERD - Software for Design Crows Foot ER Diagrams
_Win_Mac.png "Entity Relationship Diagram Software, Design Elements - Crows Foot (Windows, Macintosh)")

This wheel diagram sample was created on the base of figure illustrating the webpage "Chapter 3: Current State of the Ecosystem" of the website of the National Broadband Plan of US Federal Communications Comission (FCC). "The broadband ecosystem includes applications and content: e-mail, search, news, maps, sales and marketing applications used by businesses, user-generated video and hundreds of thousands of more specialized uses. Ultimately, the value of broadband is realized when it delivers useful applications and content to end-users.
Applications run on devices that attach to the network and allow users to communicate: computers, smartphones, set-top boxes, e-book readers, sensors, private branch exchanges (PBX), local area network routers, modems and an ever-growing list of other devices. New devices mean new opportunities for applications and content.
Finally, broadband networks can take multiple forms: wired or wireless, fixed or mobile, terrestrial or satellite. Different types of networks have different capabilities, benefits and costs.
The value of being connected to the network increases as more people and businesses choose to adopt broadband and use applications and devices that the network supports. Several factors contribute to their decisions. These include whether they can afford a connection, whether they are comfortable with digital technology and whether they believe broadband is useful.
Networks, devices and applications drive each other in a virtuous cycle. If networks are fast, reliable and widely available, companies produce more powerful, more capable devices to connect to those networks. These devices, in turn, encourage innovators and entrepreneurs to develop exciting applications and content. These new applications draw interest among end-users, bring new users online and increase use among those who already subscribe to broadband services. This growth in the broadband ecosystem reinforces the cycle, encouraging service providers to boost the speed, functionality and reach of their networks."
[broadband.gov/ plan/ 3-current-state-of-the-ecosystem/ ]
The circle pie chart example "Forces shaping the broadband ecosystem in the US" was created using the ConceptDraw PRO diagramming and vector drawing software extended with the Target and Circular Diagrams solution from the Marketing area of ConceptDraw Solution Park.
www.conceptdraw.com/ solution-park/ marketing-target-and-circular-diagrams
Wheel diagram

HelpDesk
How to Resize Objects

3 Circle Venn Diagram. Venn Diagram Example

Onion Diagram Process Design

Process Flow Chart Symbol

Process Flow Chart Symbols

Baseball Field Sample

HelpDesk
How to create an IDEF3 diagram using ConceptDraw PRO

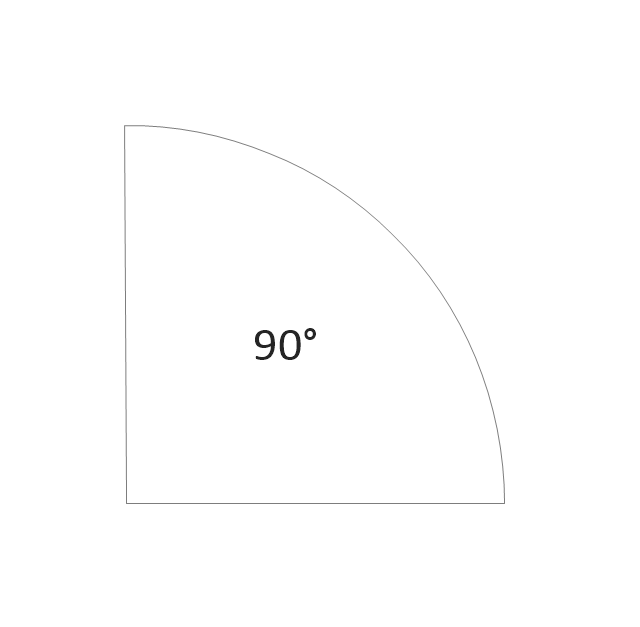
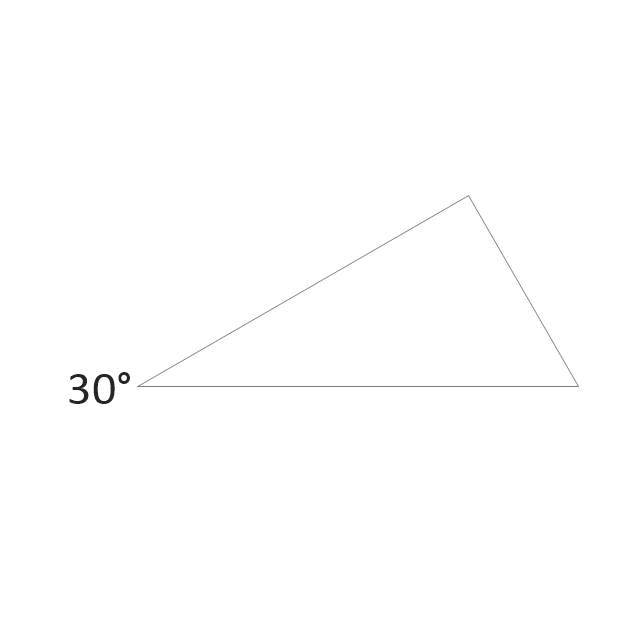
The vector stencils library "Plane geometry" contains 27 plane geometric figures.
Use these shapes to draw your geometrical diagrams and illustrations in the ConceptDraw PRO diagramming and vector drawing software extended with the Mathematics solution from the Science and Education area of ConceptDraw Solution Park.
Use these shapes to draw your geometrical diagrams and illustrations in the ConceptDraw PRO diagramming and vector drawing software extended with the Mathematics solution from the Science and Education area of ConceptDraw Solution Park.
Circular sector
Right triangle

Rectangle

Square

Pentagon

Isosceles trapezium

Parallelogram

Trapezium

Three-pointed star

Four-pointed star

Five-pointed star

Six-pointed star

Seven-pointed star

Eight-pointed star

Triangle

Equilateral triangle

Right triangle 2

Right triangle, angle box

Right triangle 3
Hexagon

Regular hexagon

Regular pentagon

Regular heptagon

Regular octagon

Rhombus

Circle

Ellipse

ERD Symbols and Meanings

What Is a Concept Map

- Sim In Circle Png
- Callout Png Circle
- Half Circle Png
- Money Circle Png
- Rectangle Box Png
- Circle White Cloud Png
- Diamond Logo Png
- Pie Circle Png
- Video Library Circle Png
- Yes No Png
- Circle 3 Part Png
- Balloon Line Png
- Circle White Png
- Circle For Numbers Vector Png
- 2 Arrow Circle Flow Icon Png
- Circle Vector Png
- Circle Pointer Design Png
- Vector Circle Png
- Octagon White Png
- How to Draw an Effective Flowchart | Circle Spoke Diagram ...