Basic Flowchart Symbols and Meaning


Block Diagram Software

Flowchart design. Flowchart symbols, shapes, stencils and icons


Venn Diagram Maker

Circle Diagrams

3 Circle Venn Diagram. Venn Diagram Example

Lean Six Sigma Diagram Software

HelpDesk
How to Draw a Circle-Spoke Diagram Using ConceptDraw PRO

UML Activity Diagram

Venn Diagram Examples for Problem Solving. Venn Diagram as a Truth Table

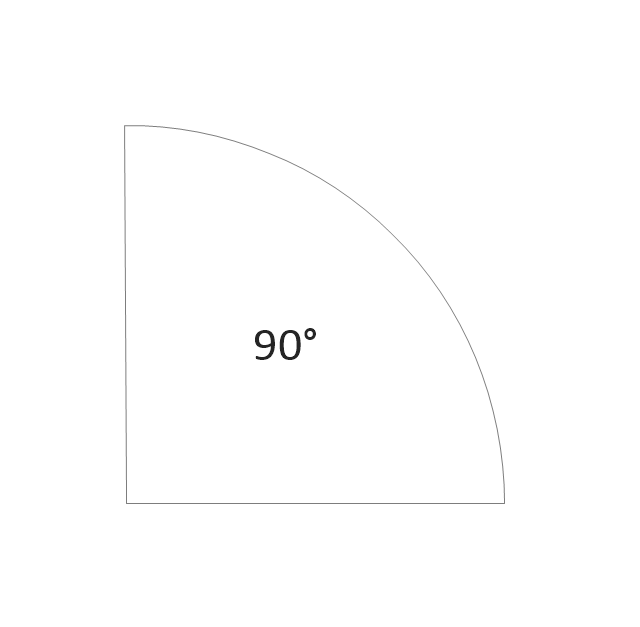
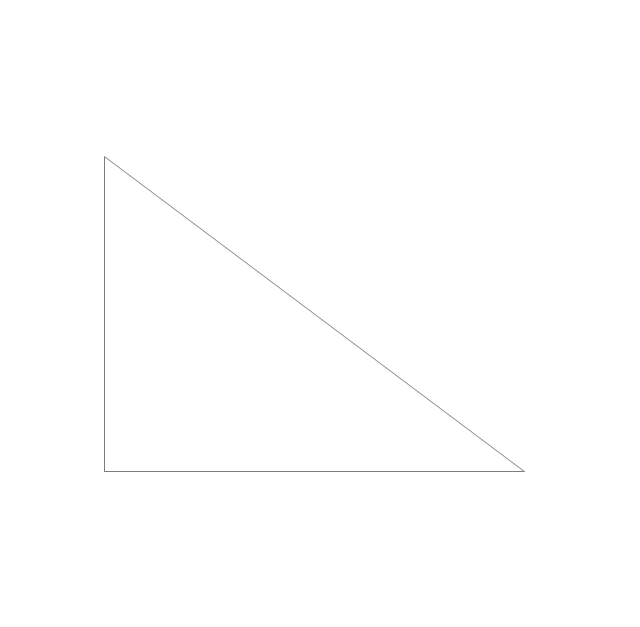
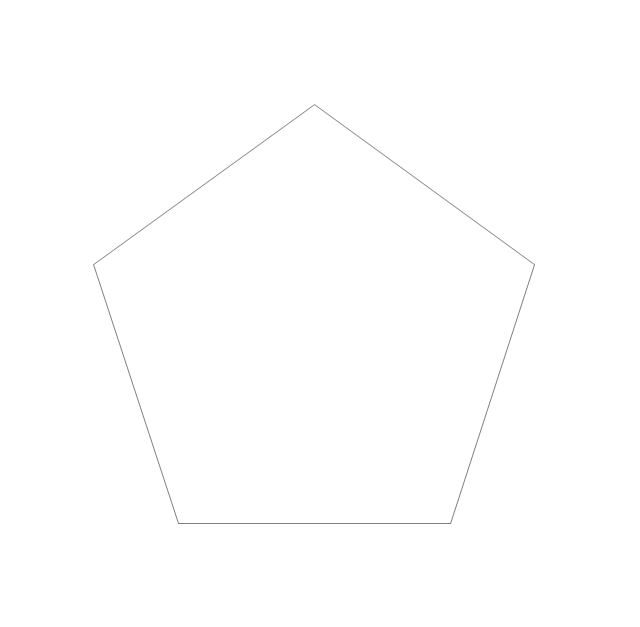
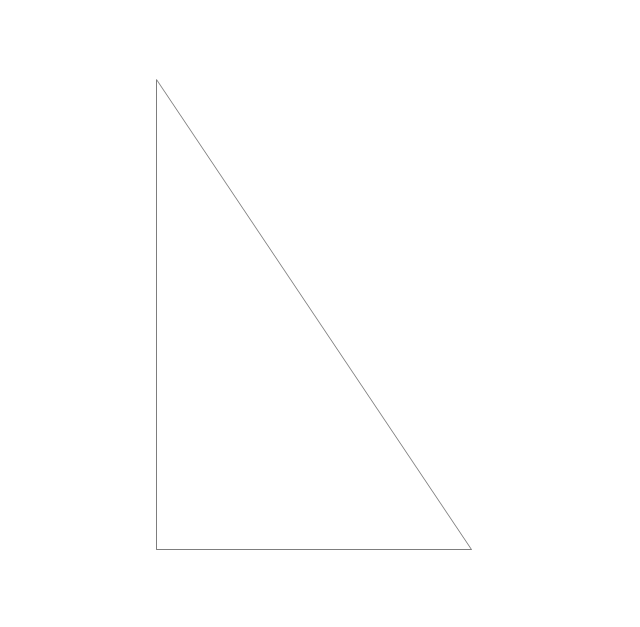
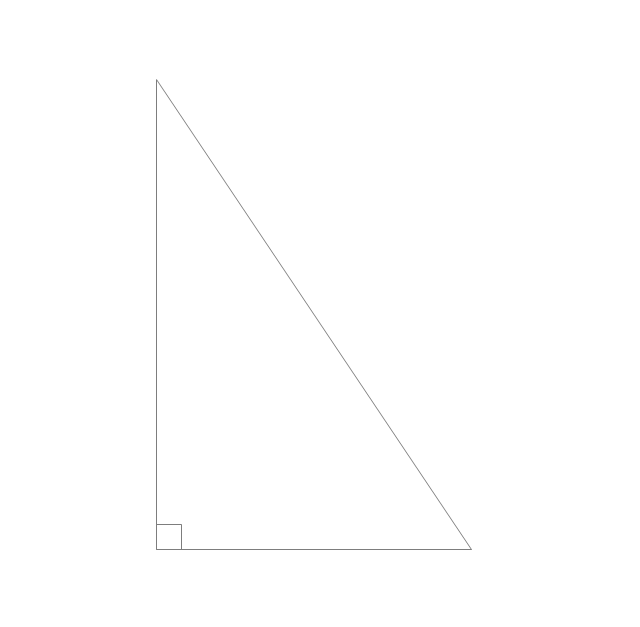
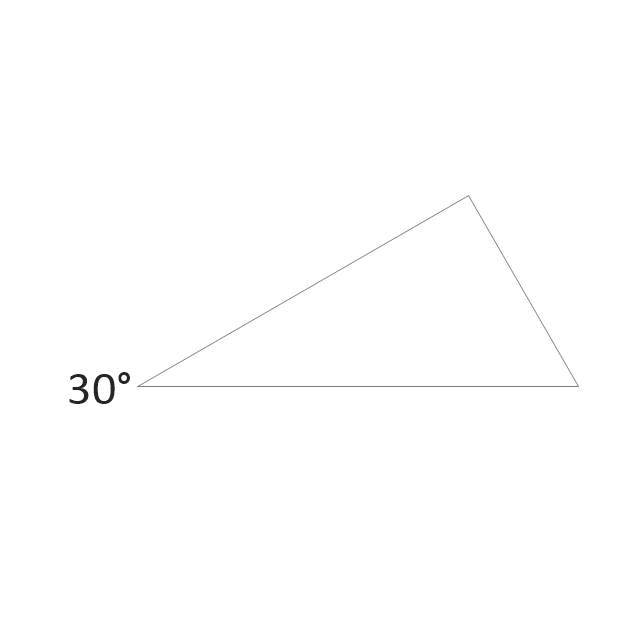
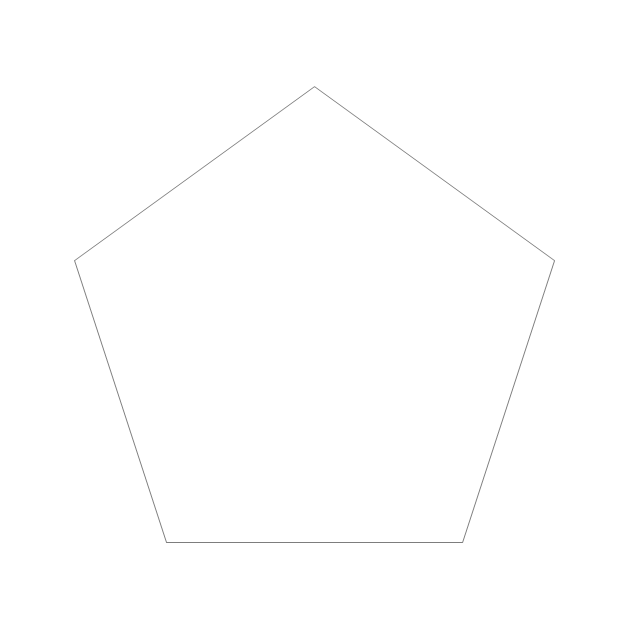
The vector stencils library "Plane geometry" contains 27 plane geometric figures.
Use these shapes to draw your geometrical diagrams and illustrations in the ConceptDraw PRO diagramming and vector drawing software extended with the Mathematics solution from the Science and Education area of ConceptDraw Solution Park.
Use these shapes to draw your geometrical diagrams and illustrations in the ConceptDraw PRO diagramming and vector drawing software extended with the Mathematics solution from the Science and Education area of ConceptDraw Solution Park.
Circular sector
Right triangle
Rectangle

Square

Pentagon
Isosceles trapezium

Parallelogram

Trapezium

Three-pointed star

Four-pointed star

Five-pointed star

Six-pointed star

Seven-pointed star

Eight-pointed star

Triangle
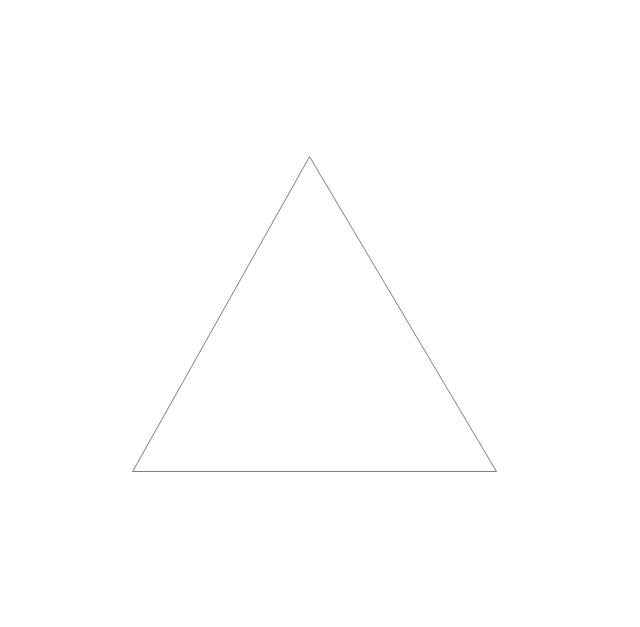
Equilateral triangle

Right triangle 2
Right triangle, angle box
Right triangle 3
Hexagon

Regular hexagon

Regular pentagon
Regular heptagon
Regular octagon
Rhombus

Circle

Ellipse

HelpDesk
How to Resize Objects

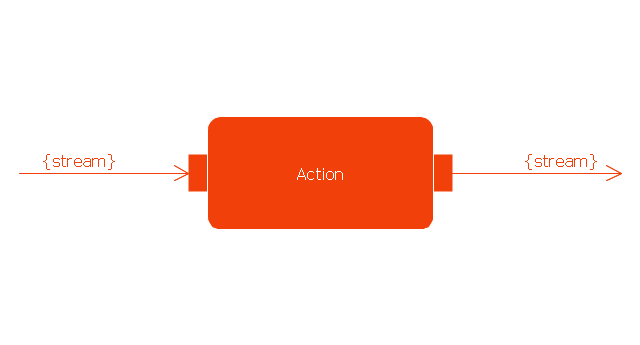
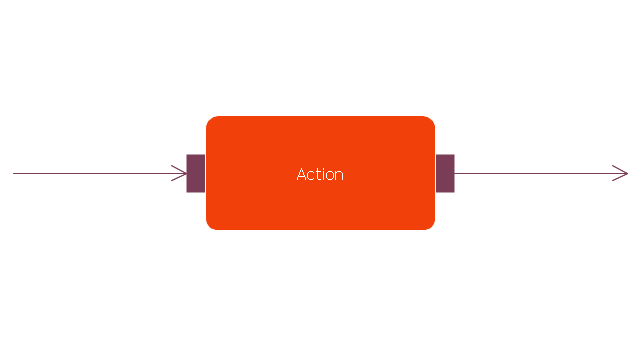
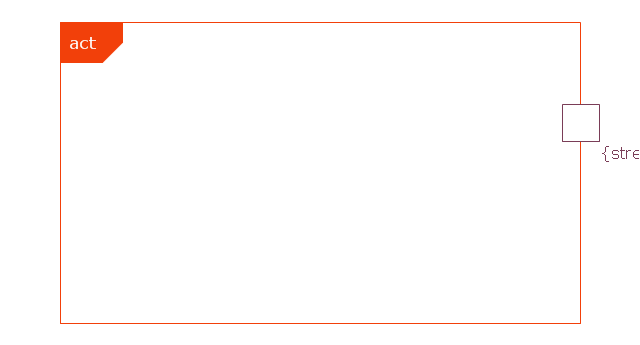
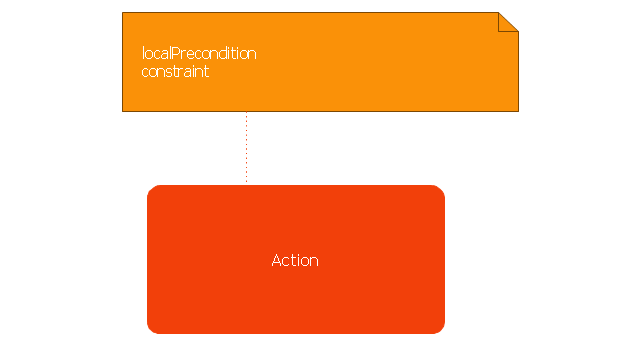
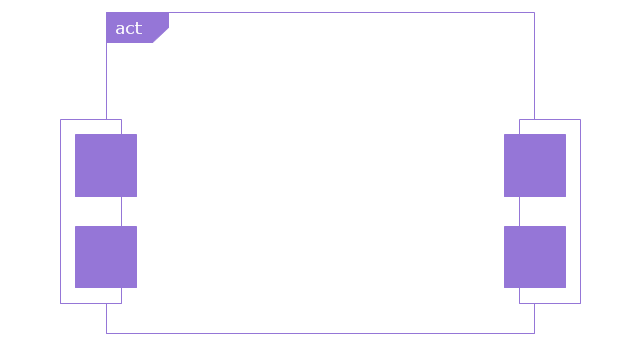
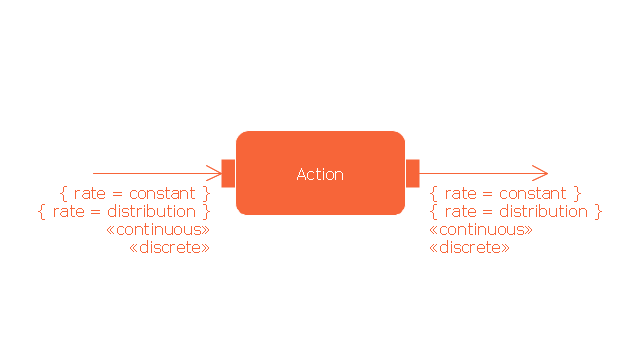
This vector stencils library contains 47 SysML activity diagram symbols.
Use it to design your SysML activity diagrams using ConceptDraw PRO diagramming and vector drawing software.
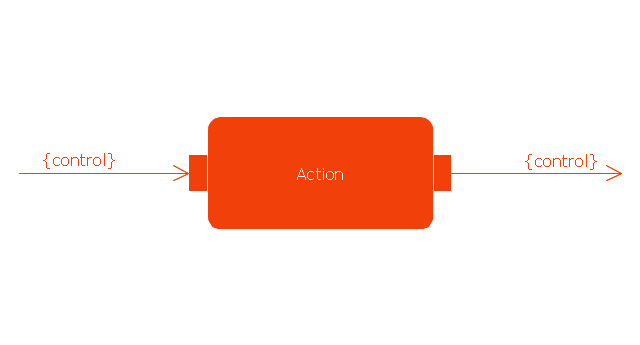
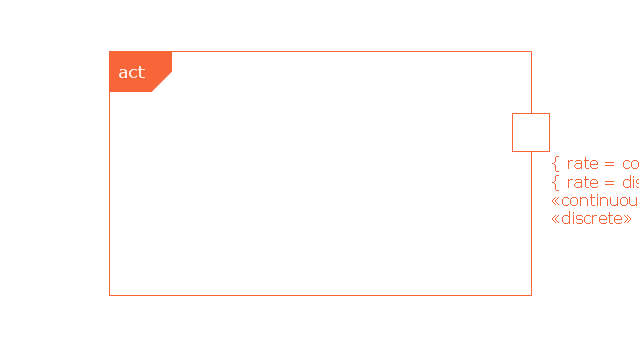
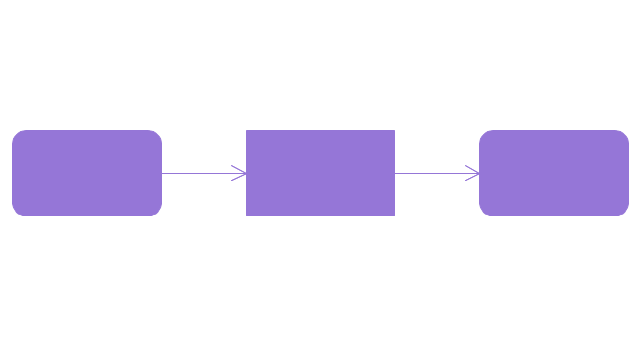
"Activity diagrams are constructed from a limited number of shapes, connected with arrows. The most important shape types:
- rounded rectangles represent actions;
- diamonds represent decisions;
- bars represent the start (split) or end (join) of concurrent activities;
- a black circle represents the start (initial state) of the workflow;
- an encircled black circle represents the end (final state).
Arrows run from the start towards the end and represent the order in which activities happen." [Activity diagram. Wikipedia]
The vector stencils library "Activity diagram" is included in the SysML solution from the Software Development area of ConceptDraw Solution Park.
Use it to design your SysML activity diagrams using ConceptDraw PRO diagramming and vector drawing software.
"Activity diagrams are constructed from a limited number of shapes, connected with arrows. The most important shape types:
- rounded rectangles represent actions;
- diamonds represent decisions;
- bars represent the start (split) or end (join) of concurrent activities;
- a black circle represents the start (initial state) of the workflow;
- an encircled black circle represents the end (final state).
Arrows run from the start towards the end and represent the order in which activities happen." [Activity diagram. Wikipedia]
The vector stencils library "Activity diagram" is included in the SysML solution from the Software Development area of ConceptDraw Solution Park.
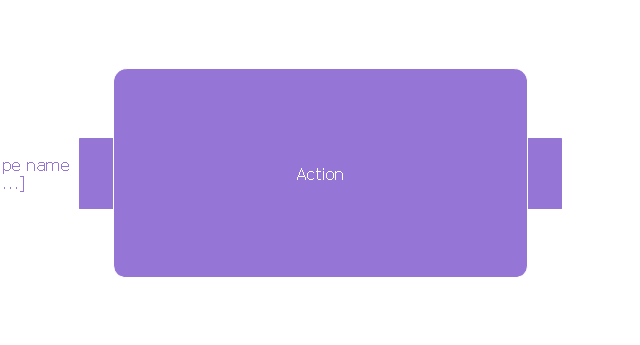
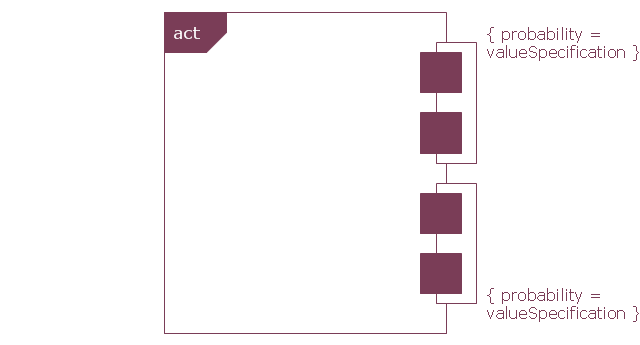
Action
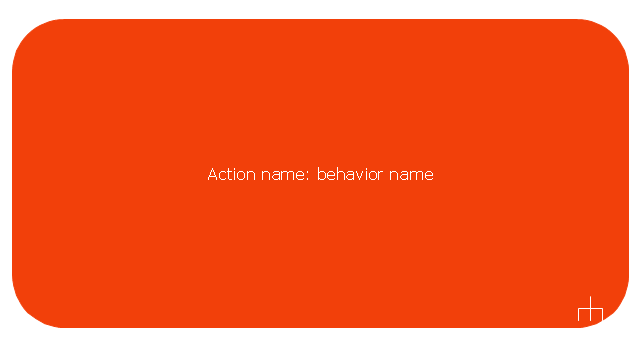
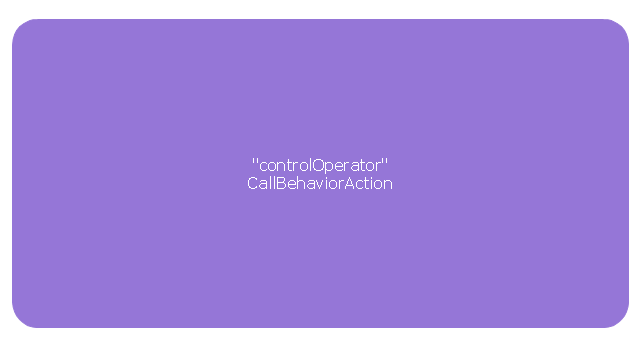
Call behavior action
Accept event action

Accept time event action

Send signal action
Activity
Activity final node
Flow final node
Activity parameter node

Control operator node
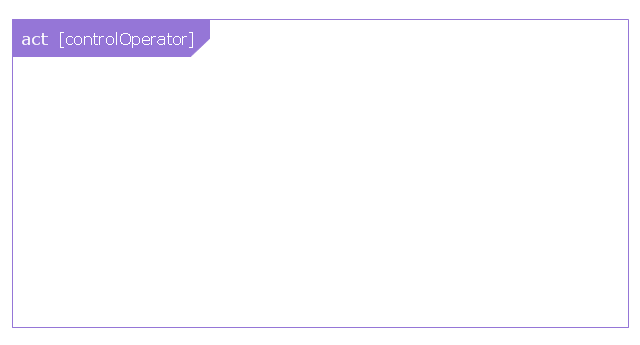
Control operator - frame
Decision/Merge node

Fork/Join node

Initial node
isControl
isStream
isStream 2
isStream 3
Local precondition
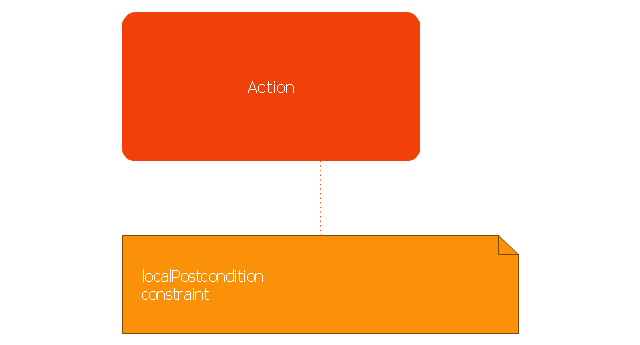
Local postcondition
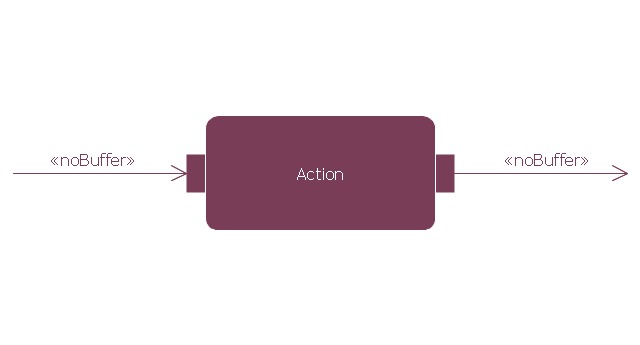
NoBuffer
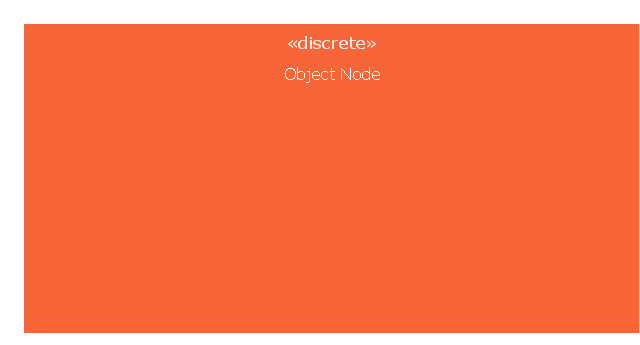
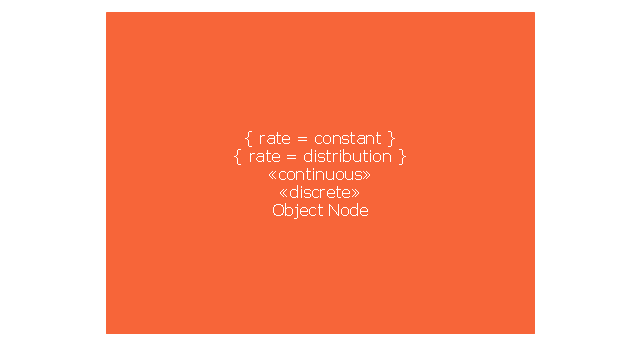
Object node
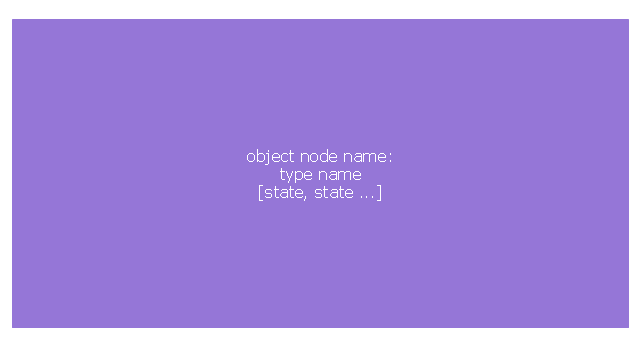
Object node 2
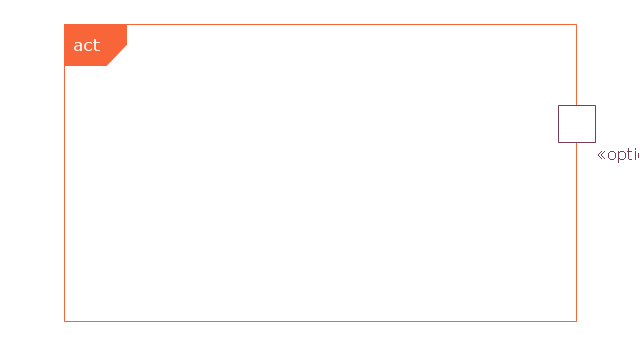
Optional
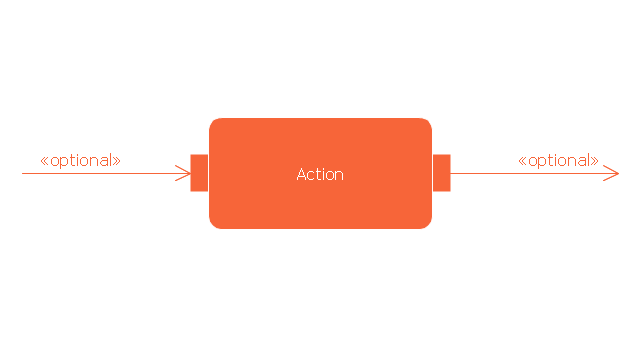
Optional 2
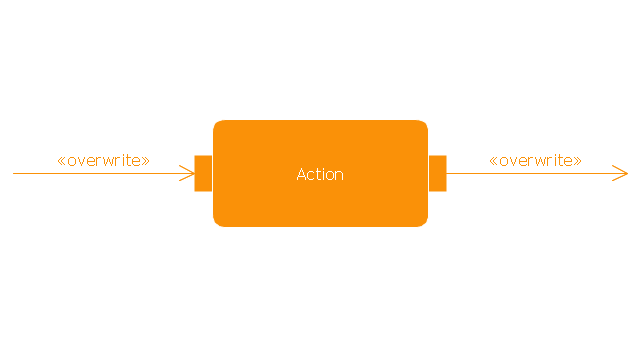
OverWrite
Parameter set
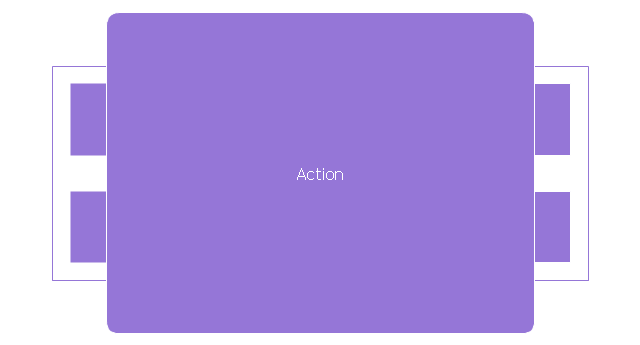
Parameter set 2
Probability
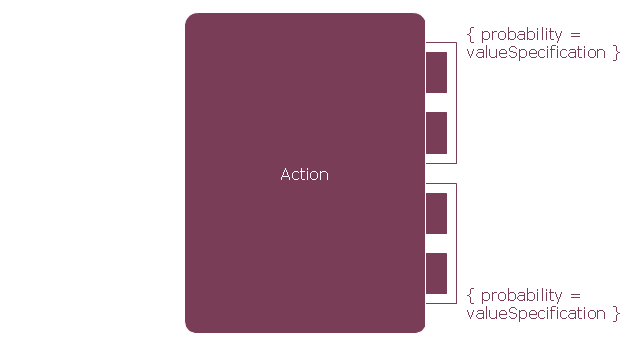
Probability 2
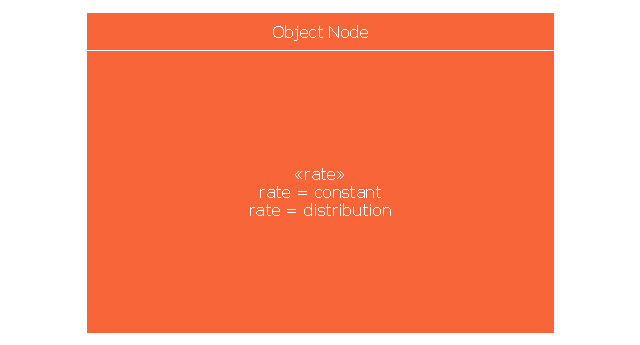
Rate
Rate 2
Rate 3
Rate 4
Rate 5
Rate 6
Control flow
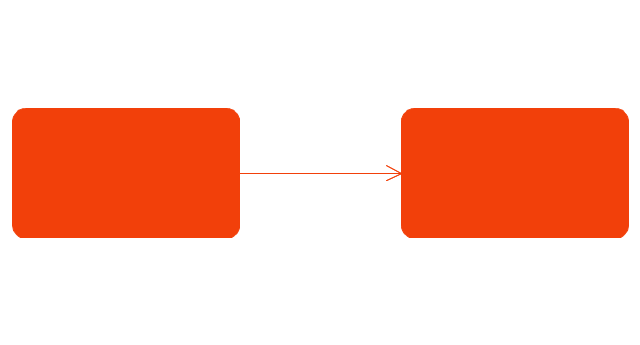
Control flow 2
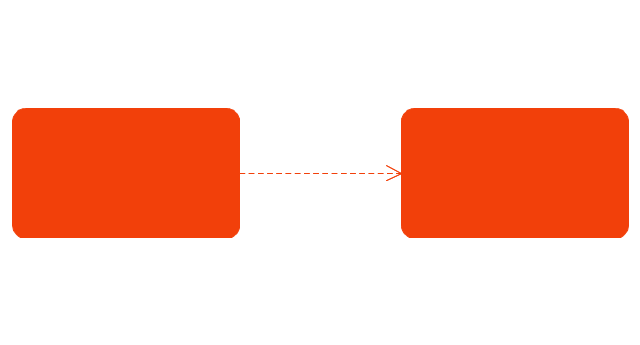
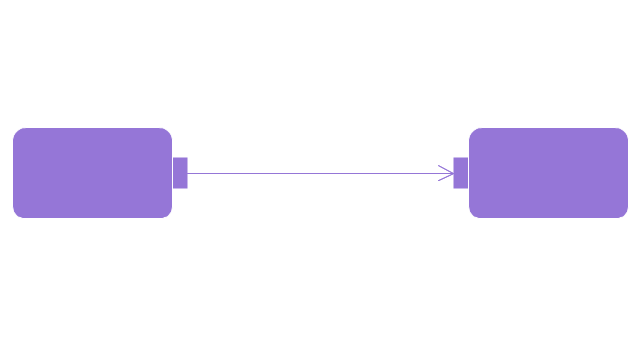
Object flow
Object flow 2
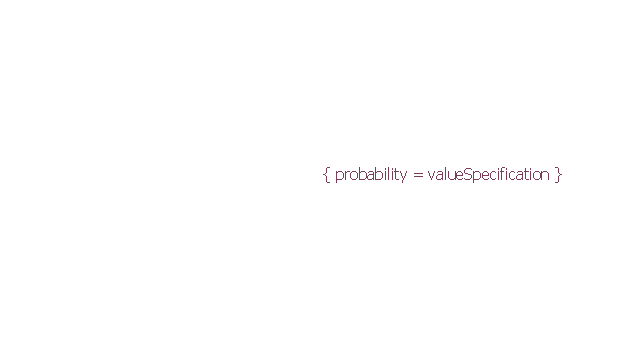
Probability path
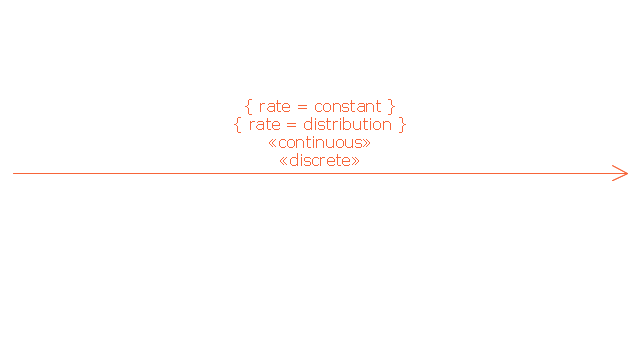
Rate path
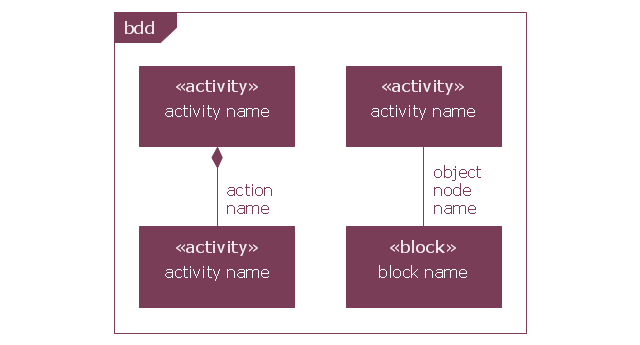
In block definition diagram, activity, association
Activity partition
Activity partition - action
Interruptible activity region
Structured activity node
Circular Diagram

 Circle-Spoke Diagrams
Examples of subject areas that are well suited to this approach are marketing, business, products promotion, process modeling, market, resource, time, and cost analysis. Circle-Spoke Diagrams are successfully used in presentations, conferences, management documents, magazines, reportages, reviews, reports, TV, and social media.
- 5 Arrow Circle Vector Png
- 3d Circle Png
- Pie Circle Png
- Pink Circle Png
- Research cycle - Circle diagram | Export from ConceptDraw PRO ...
- Elements location of a welding symbol | Research cycle - Circle ...
- GPRS network diagram | Picture graphs - Vector stencils library ...
- Vector Call To Action Png
- Plane geometry - Vector stencils library | Circular diagrams - Vector ...
- Graphic Design Circles Png
- Half Circle Png
- Transparent Circle Png
- Arrows Ring Png
- Colorful Circle Png
- Arrowed Circle Png
- Circle Spoke Diagrama Free Vector
- Research cycle - Circle diagram | Flowchart design. Flowchart ...
- Arrow Circle Png
- Presentation Vector Png
- Target Market Diagram