 CRM Center Dashboard
The CRM Center Dashboard solution extends ConceptDraw DIAGRAM functionality with CRM software tools, large collection of CRM Charts live objects, CRM icons, CRM indicators, CRM maps and navigation elements, the set of professionally designed CRM samples and templates to help you construct your own CRM Dashboards and CRM Center Dashboards in a few minutes, to depict the current and actual data by connecting or refreshing the data source file. The customer management software ConceptDraw DIAGRAM makes you free to choose the style for your dashboard and to regulate the quantity of clipart on the diagram according to your taste.
BPR Diagram. Business Process Reengineering Example

Business process Flow Chart — Event-Driven Process chain (EPC) diagrams
 diagrams *")
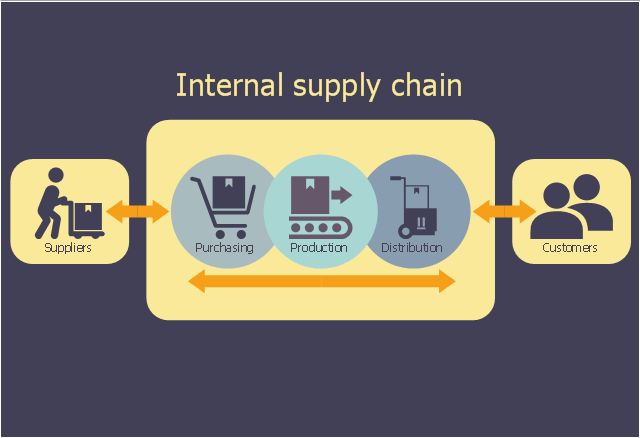
This logistic flow chart sample shows the company's supply chain. It was designed on the base of the Wikimedia Commons file: A company's supply chain (en).png. [commons.wikimedia.org/ wiki/ File:A_ company%27s_ supply_ chain_ (en).png]
This file is licensed under the Creative Commons Attribution-Share Alike 3.0 Unported license. [creativecommons.org/ licenses/ by-sa/ 3.0/ deed.en]
"A supply chain is a system of organizations, people, activities, information, and resources involved in moving a product or service from supplier to customer. Supply chain activities involve the transformation of natural resources, raw materials, and components into a finished product that is delivered to the end customer. In sophisticated supply chain systems, used products may re-enter the supply chain at any point where residual value is recyclable. Supply chains link value chains." [Supply chain. Wikipedia]
The logistic flowchart example "A company's supply chain" was created using ConceptDraw PRO diagramming and vector drawing software extended with the Logistics Flow Charts solution from the Business Processes area of ConceptDraw Solution Park.
Logistic flowchart
 Customer Journey Mapping
Customer Journey Mapping Solution for ConceptDraw DIAGRAM opens incredibly broad opportunities for marketing and business specialists, product managers, designers, engineers, and other people interested in business development, increasing the product’s audience, its success and users' demand, providing them with capabilities of customer journey mapping. The included diagramming and customer journey mapping tools, predesigned vector customer journey mapping icons and charts, consumer journey mapping connectors, user journey and customer mapping figures, customer experience map icons and touchpoint icons, quick-start templates and samples provide excellent conditions for the customer journey mapping process, for creating Customer Journey Map and Customer Experience Map.
Competitor Analysis

Basic Flowchart Symbols and Meaning


This step chart sample shows engineering value chain. It was designed on the base of the Wikimedia Commons file: The engineering value chain.png. "The engineering value chain (EVC) refers to a series of engineering activities and capabilities contributing to value creation encompassing essential elements such as idea generation & selection, design & development, production & delivery, service & support, and disposal & recycling for example." [commons.wikimedia.org/ wiki/ File:The_ engineering_ value_ chain.png]
This file is licensed under the Creative Commons Attribution-Share Alike 3.0 Unported license. [creativecommons.org/ licenses/ by-sa/ 3.0/ deed.en]
The diagram example "Step chart - Value chain" was created using the ConceptDraw PRO diagramming and vector drawing software extended with the Marketing Diagrams solution from the Marketing area of ConceptDraw Solution Park.
Marketing diagram

 Business Process Diagrams
Business Process Diagrams solution extends the ConceptDraw DIAGRAM BPM software with RapidDraw interface, templates, samples and numerous libraries based on the BPMN 1.2 and BPMN 2.0 standards, which give you the possibility to visualize equally easy simple and complex processes, to design business models, to quickly develop and document in details any business processes on the stages of project’s planning and implementation.
 Funnel Diagrams
Funnel Diagrams solution including wide range of funnel diagram samples, sales funnel examples, and vector design elements, makes the ConceptDraw DIAGRAM ideal for funnel management and creation the Funnel Diagrams of different types and designs, AIDA Model, AIDAS, ACCA Dagmar, Rossiter-Percy Model, Sales funnel, Marketing funnel, Search funnel, Brand funnel, Purchase funnel, Lead funnel, Conversion funnel, Business funnel, etc. You are free to choose to place your funnel object horizontally or vertically, you can use the objects with desired quantity of sales funnel stages, as well as to modify their size, color filling, and other parameters to make exceptionally looking Funnel diagrams fully responding to your desires.
Flowchart

Graphical Symbols to use in EPC diagrams

 Logistic Dashboard
The powerful tools of Logistic Dashboard solution and specially developed live graphic objects of logistic icons, logistic navigation elements, logistic indicators, logistic charts and logistic maps effectively assist in designing Logistic dashboards, Logistic maps, Logistic charts, diagrams and infographics. The included set of prebuilt samples and quick-start templates, demonstrates the power of ConceptDraw DIAGRAM software in logistics management, its assisting abilities in development, realization and analyzing the logistic processes, as well as in perfection the methods of logistics management.
Gantt charts for planning and scheduling projects

 Organizational Charts
Organizational Charts solution extends ConceptDraw DIAGRAM software with samples, templates and library of vector stencils for drawing the org charts.
Best Value Stream Mapping mac Software

HelpDesk
How to Create an Active Directory Diagram

 Composition Dashboard
Composition dashboard solution extends ConceptDraw DIAGRAM software with templates, samples and vector stencils library with charts and indicators for drawing visual dashboards showing data composition.
 Time Series Dashboard
Time series dashboard solution extends ConceptDraw DIAGRAM software with templates, samples and vector stencils libraries with charts, graphs and plots for drawing the visual dashboards showing data time series.
- Flow Chart Showing The Chain Of Customer Service In Your Business
- Basic Flowchart Symbols and Meaning | Work Flow Chart | Process ...
- Draw A Diagram That Illustrates The Chain Of Customer Service
- Diagram That Illustrates The Chain Of Customer Service
- Workflow diagrams - Vector stencils library | Customer Service ...
- Draw A Diagram That Illustrate The Chain Of Customer Service
- Process Flowchart | Basic Flowchart Symbols and Meaning ...
- Customer Service Flow Chart Template
- Flow Chat Of The Process Of Customer Service In Hospitality Industry
- Business Services Flow Chart
- Customer Support Flowchart
- Chain Market Flow Chart
- Workflow Diagrams | Business Process Workflow Diagrams ...
- Customer Support Diagram
- Flowchart | Flow Chart Of Chat Service
- Porter's Value Chain | Marketing Diagrams | Logistics Flow Charts ...
- Process Flowchart | Flow Diagram Software | Cross-Functional ...
- Customer Service
- How to Use a Cross - Functional Flowcharts Solution | Flow Chart Of ...
- Customer Service Number Draw