Basic Audit Flowchart. Flowchart Examples
This sample shows the Audit Process Flowchart. It was created in ConceptDraw DIAGRAM diagramming and vector drawing software using the Flowcharts solution from the Diagrams area of ConceptDraw Solution Park. The Audit Flowcharts are widely used in the financial management, accounting, money management and in many others fields.Business process Flow Chart — Event-Driven Process chain (EPC) diagrams
Event-Driven Process chain Diagrams for improvement throughout an organisation. Best software for Process Flow Diagram. The Event-driven Process Chain (EPC) Diagrams allows managers to plan processes and resources.HR Flowchart Symbols
Human resources are the people who make up the employee workforce of an organization or company. Human resource management has four basic functions: staffing, motivation, training and development, and maintenance. It is convenient to use the flowcharts to represent various HR processes and workflows. ConceptDraw DIAGRAM diagramming and vector drawing software extended with HR Flowcharts solution from the Management area of ConceptDraw Solution Park supplies you with comprehensive selection of predesigned vector HR flowchart symbols and standardized flowchart notation symbols, which allow you to design effectively the eye-catching infographics and diagrams relating to any human resource management process that will be relevant and understood by all business associates. The ConceptDraw DIAGRAM software offers also the set of predesigned flowchart and workflow templates and samples making your drawing process as easy as possible. Use the HR Flowcharts solution to create professional-looking HR Flowcharts and HRM Business Process Diagrams in a matter of moments.3 Circle Venn. Venn Diagram Example
This example shows the 3 Circle Venn Diagram. The Venn Diagrams visualize all possible logical intersections between several sets. On this example you can see the intersections of 3 sets. Venn Diagrams are widely used in mathematics, logic, statistics, marketing, sociology, etc.Bar Diagrams for Problem Solving. Create business management bar charts with Bar Graphs Solution
Create bar charts for business management problem solving and data comparison using the ConceptDraw DIAGRAM diagramming and vector drawing software extended with the Bar Graphs Solution from the Graphs and Charts area of ConceptDraw Solition Park.Flow Chart Creator
It is impossible to imagine the managing and analyzing of business and technical processes without flowcharts. They are the best way to visually represent the structural data, algorithms, the steps of the process, they allow to illustrate the process flow direction and solution to a given problem. ConceptDraw DIAGRAM diagramming and vector drawing software extended with flowchart maker and Flowcharts Solution from the "Diagrams" Area is a powerful Flow Chart Creator.Competitor Analysis
Competitor analysis is a first and obligatory step in elaboration the proper corporate marketing strategy and creating sustainable competitive advantage. Use powerful opportunities of numerous solutions from ConceptDraw Solution Park for designing illustrative diagrams, charts, matrices which are necessary for effective competitor analysis.Venn Diagram Examples for Problem Solving. Environmental Social Science. Human Sustainability Confluence
The Venn diagram example below shows sustainable development at the confluence of three constituent parts. Create your Venn diagrams for problem solving in environmental social science using the ConceptDraw DIAGRAM diagramming and vector drawing software extended with the Venn Diagrams solution from the area "Diagrams" of ConceptDraw Solution Park.Bar Graph
You need to draw the Bar Graph? The automated tool can be useful for you. ConceptDraw DIAGRAM diagramming and vector drawing software extended with Bar Graphs solution from Graphs and Charts area of ConceptDraw Solution Park will help you create any Bar Graph.UML Sequence Diagram Example. SVG Vectored UML Diagrams Tools
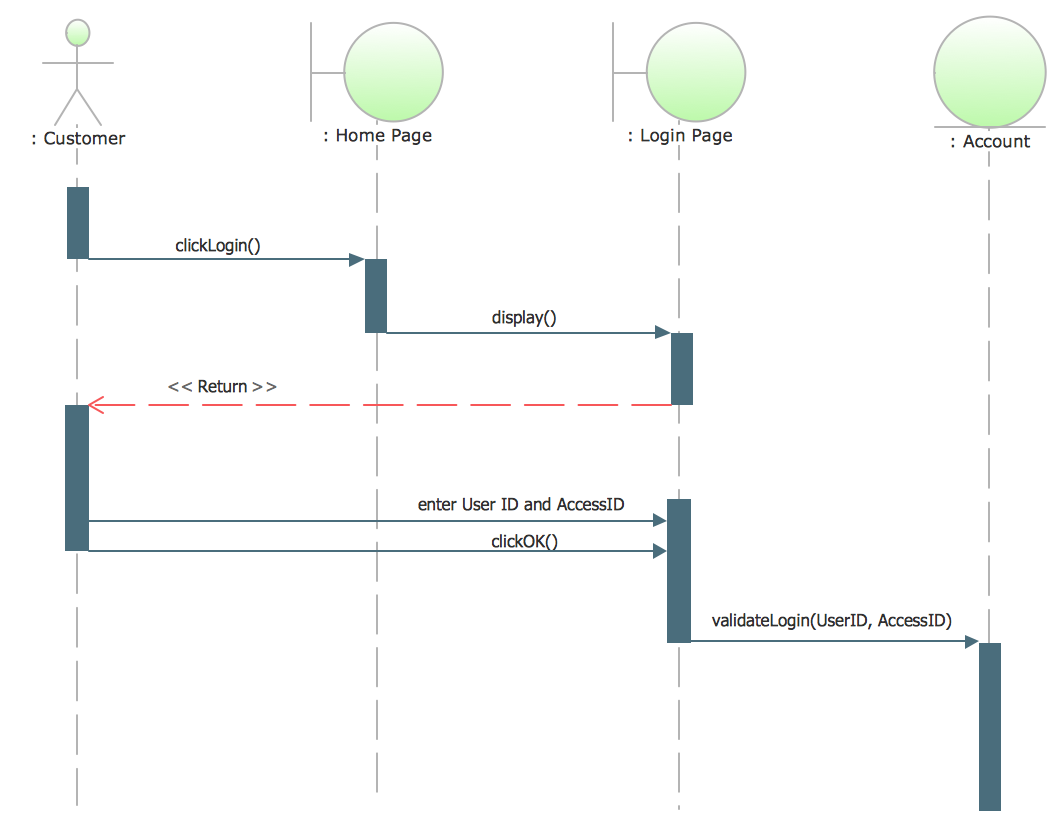
This sample was created in ConceptDraw DIAGRAM diagramming and vector drawing software using the UML Sequence Diagram library of the Rapid UML Solution from the Software Development area of ConceptDraw Solution Park. This sample shows the interactions of the customer with the system and is used at the registration on the sites.ConceptDraw DIAGRAM UML Diagrams with ConceptDraw DIAGRAM
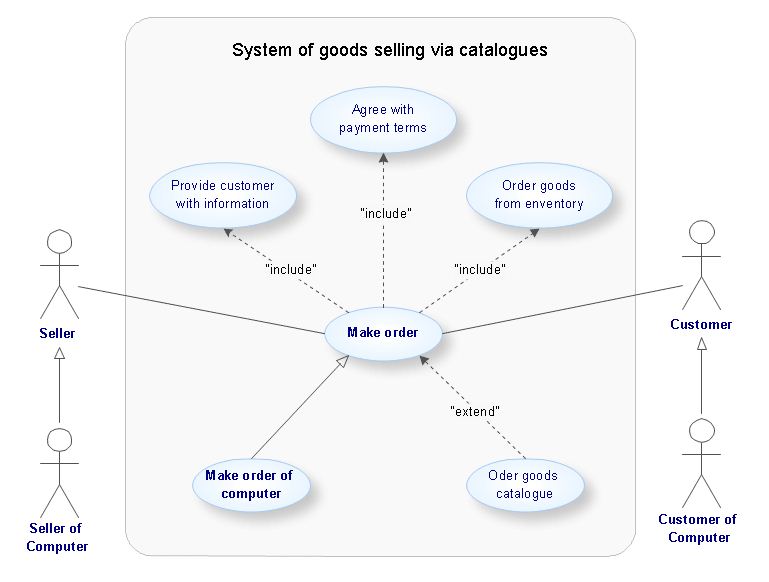
ConceptDraw DIAGRAM is a great UML modeling and design tool that enables you to quickly and easily generate all types of UML diagrams. ConceptDraw DIAGRAM offers a large collection of industry-standard UML object libraries for all types of UML diagrams.Example Process Flow Chart
ConceptDraw DIAGRAM is a powerful diagramming and vector drawing software. Extended with Flowcharts solution from the "Diagrams" area, ConceptDraw DIAGRAM became the ideal software for making an example Process Flow Chart.UML Deployment Diagram. Design Elements
UML Deployment diagram describes the hardware used in system implementations and the execution environments and artifacts deployed on the hardware. ConceptDraw has 393 vector stencils in the 13 libraries that helps you to start using software for designing your own UML Diagrams. You can use the appropriate stencils of UML notation from UML Deployment library.
 Target and Circular Diagrams
This solution extends ConceptDraw DIAGRAM software with samples, templates and library of design elements for drawing the Target and Circular Diagrams.
 Cloud Computing Diagrams
The Cloud Computing Diagrams solution extends the functionality of the ConceptDraw DIAGRAM diagramming software with a comprehensive collection of libraries of commonly accepted cloud computing vector stencils to help you to get started designing Cloud Computing Diagrams, Architecture Diagrams and Cloud Computing Architecture Diagrams without effort. This solution lets one professionally depict the way how the cloud computing works, allows giving a powerful introduction to the Cloud computing architecture and Amazon cloud computing architecture, to display the essence of the cloud computing, the main characteristics and classification of the cloud services thanks to the wide variety of predesigned samples and examples.
Block Diagram Software
The popularity of Block Diagrams grows day by day. The existence of powerful software for their design is an excellent news! ConceptDraw DIAGRAM Block Diagram Software offers the Block Diagrams Solution from the "Diagrams" Area.
 ATM UML Diagrams
The ATM UML Diagrams solution lets you create ATM solutions and UML examples. Use ConceptDraw DIAGRAM as a UML diagram creator to visualize a banking system.
 Business Diagrams
The Business Diagrams Solution extends ConceptDraw DIAGRAM with an extensive collection of professionally designed illustrative samples and a wide variety of vector stencils libraries, which are the real help for all business-related people, business analysts, business managers, business advisers, marketing experts, PR managers, knowledge workers, scientists, and other stakeholders allowing them to design the bright, neat, expressive and attractive Bubble Diagrams, Circle-Spoke Diagrams, Circular Arrows Diagrams, and Venn Diagrams with different quantity of sets in just minutes; and then successfully use them in documents, reports, statistical summaries, and presentations of any style.
What is SWOT Analysis?
What is SWOT analysis? The SWOT abbreviation is formed from the reduction of four words - strength, weakness, opportunity and threat, on which is based the SWOT analysis. It is a structured planning method that involves the analysis of the situation within a company, as well as analysis of external factors and the situation on the market. SWOT analysis emphasizes that the strategy must to combine the internal capabilities and external situation the best way as possible. The use of SWOT analysis allows to systemize all available information and apply this clear picture to make informed decisions concerning to your business development. In fact, SWOT analysis is an intermediate step between the formulation of goals and the statement of problem. The main goal is a sustainability and improvement of efficiency of business functioning. When you have an installed ConceptDraw DIAGRAM software, it gives you a lot of benefits in SWOT analysis. Use the powerful drawing tools and capabilities of the SWOT and TOWS Matrix Diagrams solution to hold the SWOT analysis effectively and with pleasure.- Draw A Chart On Components Of Environment
- Components Of Environment Draw The Diagram
- Chart Diagram Showing Different Component Of Environment
- Draw A Flowchart Of Component Of Environment
- Draw The Components Of Environment
- Flow Chart On Components Of Environment
- Draw A Flowchart Of Component Of Environment With Picture
- Draw A Diagram Of The Major Components Of Environment
- Venn Diagrams | Make A Diagram Of Components Of Environment
- Accounting Information Systems Flowchart Symbols | Software ...
- Flowchart Components | Local area network (LAN). Computer and ...
- UML Component Diagram | Components of ER Diagram | UML ...
- WEHUB Flowchart | Flow Chart That Shows The Relationship ...
- Expain The Components Of Environment On A Flow Chart
- UML Component Diagram
- Business Environment Flow Chart
- Draw A Chart Of Business Environment
- Flow Chart Of Types Of Business Environment
- Simple Drawing Applications for Mac | Components of ER Diagram ...
- Types Of Environment Flowchart


