 Fishbone Diagram
Fishbone Diagrams solution extends ConceptDraw DIAGRAM software with templates, samples and library of vector stencils for drawing the Ishikawa diagrams for cause and effect analysis.
Fishbone Diagram Problem Solving

Business Diagram Software


Using Fishbone Diagrams for Problem Solving

 Management
This solution extends ConceptDraw DIAGRAM and ConceptDraw MINDMAP with Management Diagrams and Mind Maps (decision making, scheduling, thinking ideas, problem solving, business planning, company organizing, SWOT analysis, preparing and holding meetings
Total Quality Management with ConceptDraw

 Cisco Network Diagrams
Cisco Network Diagrams solution extends ConceptDraw DIAGRAM with the best characteristics of network diagramming software. Included samples, templates and libraries of built-in standardized vector Cisco network icons and Cisco symbols of computers, network devices, network appliances and other Cisco network equipment will help network engineers, network designers, network and system administrators, as well as other IT professionals and corporate IT departments to diagram efficiently the network infrastructure, to visualize computer networks topologies, to design Cisco computer networks, and to create professional-looking Cisco Computer network diagrams, Cisco network designs and schematics, Network maps, and Network topology diagrams in minutes.
 PM Response
The PM Response solution extends the functional abilities in project management for all three ConceptDraw products by helping to improve the response time to project changes, to plan on how to effectively respond on issues and events impacting the project. It supplies the project managers, team leaders, and all other project participants with wide abilities of iteration planning, creative collaboration, effective decision-making, discussions of the project layout approaches and solving the project challenges, lets them use mind mapping technique for iteration planning and applying the project changes, to represent the projects data as Mind Maps and use them to construct the clear plans, to convert project maps to project implementations, to use different kinds of Visual diagrams to solve the current project problems and to make correct decisions, to plan resources usage and to respond to changes in the project environment.
 Business Processes Area
Solutions of Business Processes area extend ConceptDraw DIAGRAM software with samples, templates and vector stencils libraries for drawing business process diagrams and flowcharts for business process management.
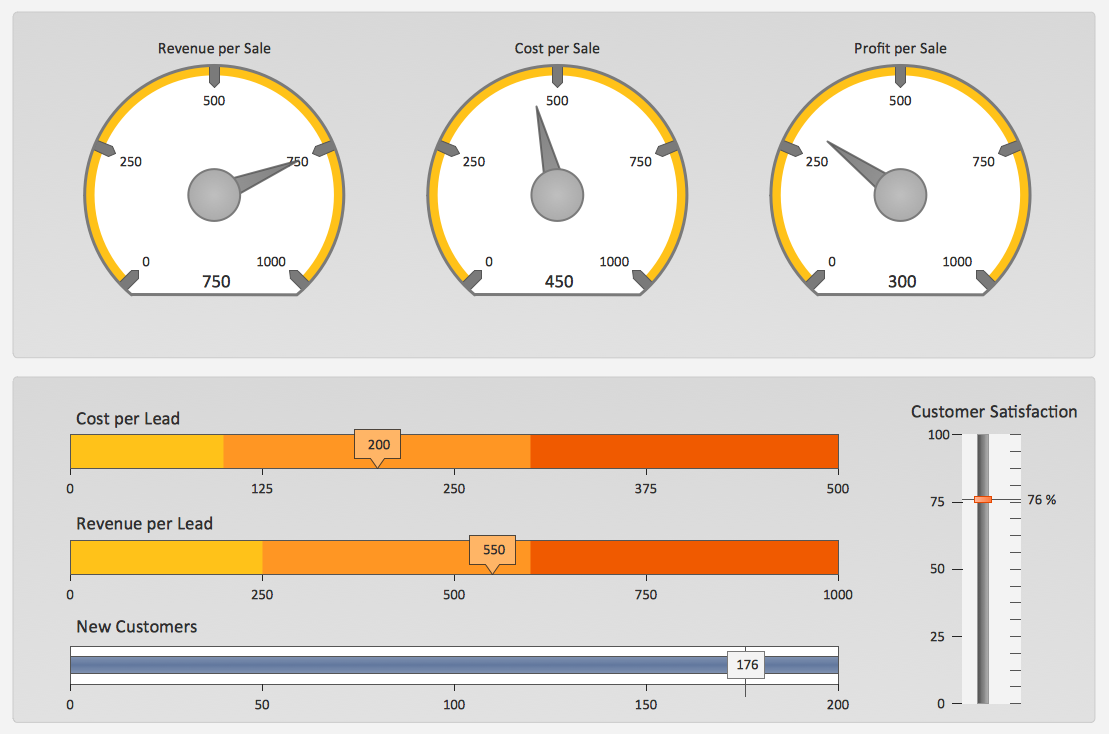
Sales KPI Dashboards
 Correlation Dashboard
Correlation dashboard solution extends ConceptDraw DIAGRAM software with samples, templates and vector stencils library with Scatter Plot Charts for drawing the visual dashboard visualizing data correlation.
 Seven Management and Planning Tools
Seven Management and Planning Tools solution extends ConceptDraw DIAGRAM and ConceptDraw MINDMAP with features, templates, samples and libraries of vector stencils for drawing management mind maps and diagrams.
 ConceptDraw Solution Park
ConceptDraw Solution Park collects graphic extensions, examples and learning materials
- Using Fishbone Diagrams for Problem Solving | Education ...
- Fishbone Diagram | Business Productivity Diagramming | Using ...
- Fishbone Diagram | Universal Diagramming Area - Conceptdraw.com
- Fishbone Diagram | Business Productivity Diagramming | Using ...
- Business Productivity Diagramming | Cause and Effect Analysis ...
- Fishbone Diagram | Business Productivity Diagramming | Business ...
- Fishbone Diagram | Using Fishbone Diagrams for Problem Solving ...
- Universal Diagramming Area | Fishbone Diagram | Education |
- Using Fishbone Diagrams for Problem Solving | Business ...
- Fishbone Diagram | Business Productivity Diagramming | Using ...
- Fishbone Diagram | Crow's foot ERD - Educational data base ...
- Education | Presentations in Educational Process | Universal ...
- PROBLEM ANALYSIS Prioritization Matrix | PROBLEM ANALYSIS ...
- Cause and Effect Analysis (Fishbone Diagrams) | Business ...
- Fishbone Diagram | Management | PM Response |
- Fishbone Diagram | Management | Process Flowchart |
- Fishbone Diagram | Business Productivity Diagramming | Sales KPI ...
- Fishbone Diagram | Business Productivity Diagramming | Cause ...
- Fishbone Diagram | Cause and Effect Analysis (Fishbone Diagrams ...
- Cause and Effect Analysis (Fishbone Diagrams) | Business ...