 Fishbone Diagram
Fishbone Diagrams solution extends ConceptDraw DIAGRAM software with templates, samples and library of vector stencils for drawing the Ishikawa diagrams for cause and effect analysis.
Fishbone Diagram Problem Solving

Using Fishbone Diagrams for Problem Solving

Business Diagram Software


 Management
This solution extends ConceptDraw DIAGRAM and ConceptDraw MINDMAP with Management Diagrams and Mind Maps (decision making, scheduling, thinking ideas, problem solving, business planning, company organizing, SWOT analysis, preparing and holding meetings
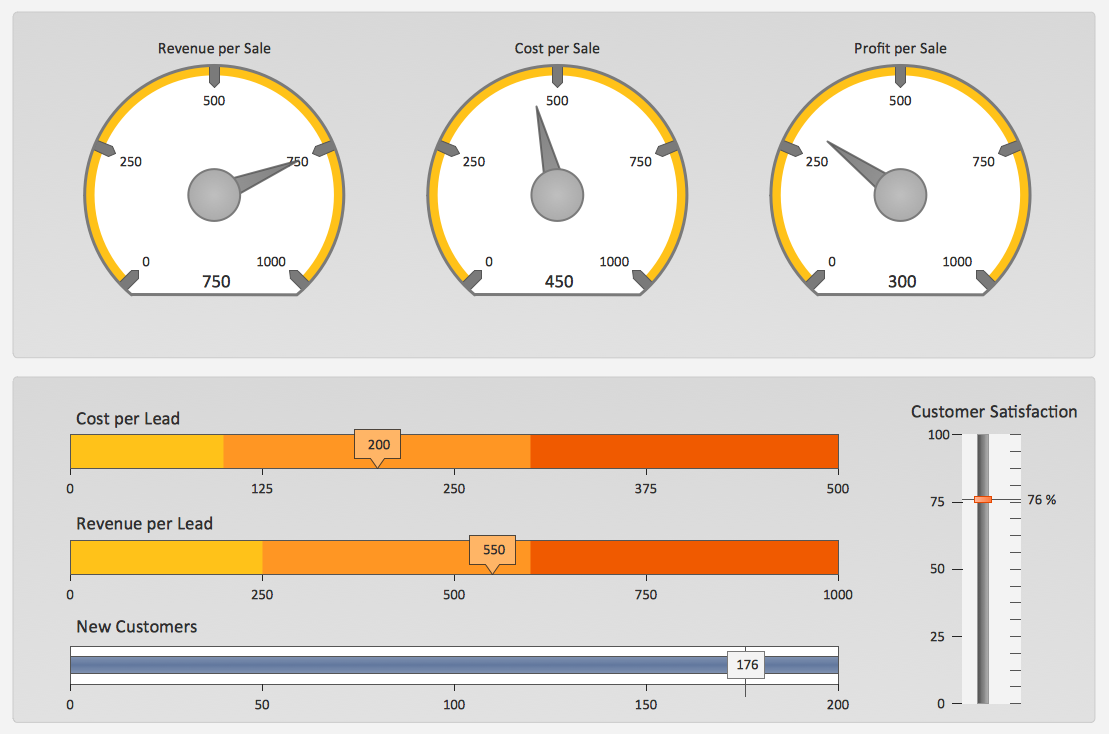
Sales KPI Dashboards
 Seven Management and Planning Tools
Seven Management and Planning Tools solution extends ConceptDraw DIAGRAM and ConceptDraw MINDMAP with features, templates, samples and libraries of vector stencils for drawing management mind maps and diagrams.
 ConceptDraw Solution Park
ConceptDraw Solution Park collects graphic extensions, examples and learning materials
 Language Learning
Language Learning solution extends ConceptDraw DIAGRAM software with templates, samples and library of vector stencils for drawing the sentence diagrams.
- Using Fishbone Diagrams for Problem Solving | Education ...
- Fishbone Diagram | Universal Diagramming Area - Conceptdraw.com
- SWOT Analysis | SWOT analysis matrix diagram templates ...
- Fishbone Diagram | Using Fishbone Diagrams for Problem Solving ...
- Using Fishbone Diagrams for Problem Solving | Business ...
- Fishbone Diagram | Business Productivity Diagramming | Using ...
- Using Fishbone Diagrams for Problem Solving | Business ...
- Fishbone Diagram | Business Productivity Diagramming | Business ...
- Cause and Effect Analysis ( Fishbone Diagrams ) | Business ...
- Fishbone Diagram | Business Productivity Diagramming | Business ...
- Fishbone Diagram | Business Productivity Diagramming | Business ...
- Fishbone Diagram | Business Productivity Diagramming | Business ...
- Business Productivity Diagramming | Ishikawa diagram - Factors ...
- Cause and Effect Analysis ( Fishbone Diagrams )
- Business Productivity Diagramming | Total Quality Management with ...
- Universal Diagramming Area | Education | Fishbone Diagram |
- Using Fishbone Diagrams for Problem Solving | Fishbone Diagram ...
- Fishbone Diagram | Business Productivity Diagramming | Cross ...
- Making Diagrams Has Never Been Easier | Diagrama de Topologia ...
- Crow's foot ERD - Educational data base | Entity-Relationship ...