Process Flowchart


Types of Flowcharts


Basic Flowchart Symbols and Meaning


Business Process Flowchart

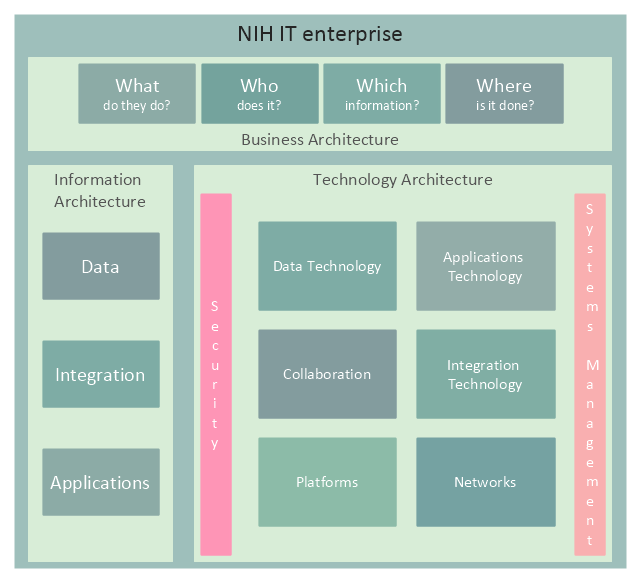
This enterprise architecture diagram sample was redesigned from the illustration of the NIH Enterprise Architecture website. [enterprisearchitecture.nih.gov/ Pages/ Framework.aspx]
"Enterprise architecture is a comprehensive framework used to manage and align an organization's Information Technology (IT) assets, people, operations, and projects with its operational characteristics. In other words, the enterprise architecture defines how information and technology will support the business operations and provide benefit for the business.
It illustrates the organization’s core mission, each component critical to performing that mission, and how each of these components is interrelated. These components include:
(1) Guiding principles,
(2) Organization structure,
(3) Business processes,
(4) People or stakeholders,
(5) Applications, data, and infrastructure,
(6) Technologies upon which networks, applications and systems are built.
Guiding principles, organization structure, business processes, and people don’t sound very technical. That’s because enterprise architecture is about more than technology. It is about the entire organization (or enterprise) and identifying all of the bits and pieces that make the organization work." [enterprisearchitecture.nih.gov/ Pages/ what.aspx]
The example "NIH IT enterprise architecture framework" was created using the ConceptDraw PRO diagramming and vector drawing software extended with the Enterprise Architecture Diagrams solution from the Management area of ConceptDraw Solution Park.
Enterprise architecture diagram
Bar Diagrams for Problem Solving. Create business management bar charts with Bar Graphs Solution

Sales Dashboard - insight about potential opportunities and key sales operations

Business Processes description with ConceptDraw PRO

Flowchart Components

Create a Cross-Functional Flowchart

Business Processes

Sales Dashboards for Your Company

Flow chart Example. Warehouse Flowchart


Best Program to Make Flow Chart Diagrams

Business Process Flowchart Symbols

- Business Operational Flow Chart
- Entity-Relationship Diagram (ERD) | Business Operations Chart Exa
- Enterprise Architecture Diagrams | Business Architecture | How to ...
- Operation Process Flow Chart Example
- Flow Process Chart In Operations Management
- Flow Chart Images For Bank Operations
- The 8ms Of Operation Management
- Process Flowchart | Business Processes | Basic Flowchart Symbols ...
- Process Flowchart | Business Process Flowchart Symbols | Flow ...
- Operations Architecture Diagram
- Enterprise Architecture Diagrams | Information Technology ...
- Operations Dashboard Template Visio
- Process Flowchart | Product Overview | Business Diagram Software ...
- Operations Chart Template
- Business Operations Vector
- IDEF Business Process Diagrams | Business Architecture ...
- Enterprise Architecture Diagrams | How to Create an Enterprise ...
- Explain Th 8ms In Production And Operations Management
- Flow chart Example. Warehouse Flowchart | Business Process ...