Process Flowchart


Business Processes

Copying Service Process Flowchart. Flowchart Examples

Cross-Functional Flowchart (Swim Lanes)

Types of Flowcharts


Business Processes description with ConceptDraw PRO

Intelligent Services Gateway (ISG) network. Computer and Network Examples


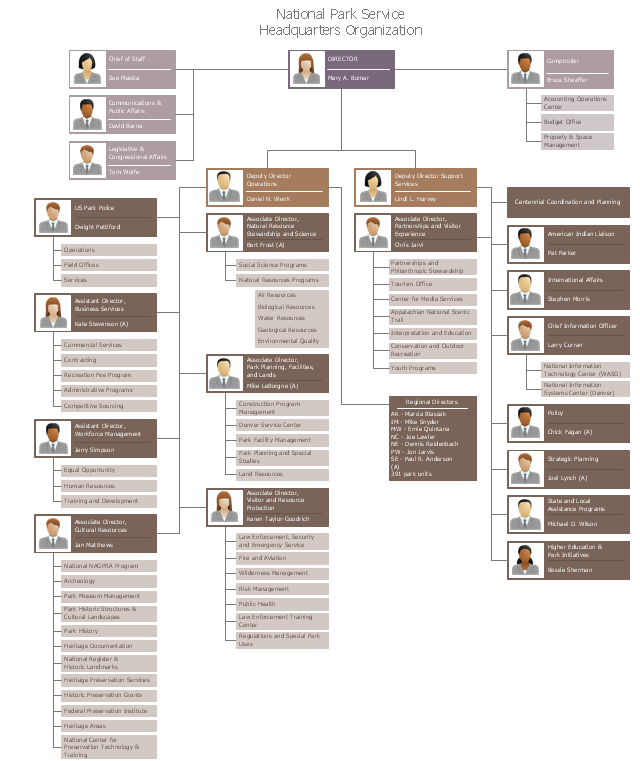
This organization chart of the National Park Service was redesigned from the Wikimedia Commons file: WASO Org Chart.JPG. [commons.wikimedia.org/ wiki/ File:WASO_ Org_ Chart.JPG]
"The National Park Service in the United States is a Bureau of the Department of the Interior with its headquarters located in Washington, D.C. The bureau consist of numerous support offices and seven regional offices, which oversee park operations within their geographic area." [Organization of the National Park Service. Wikipedia]
The org chart sample "National Park Service" was created using the ConceptDraw PRO diagramming and vector drawing software extended with the 25 Typical Organizational Charts solution from the Management area of ConceptDraw Solution Park.
Org chart
Cross-Functional Flowchart


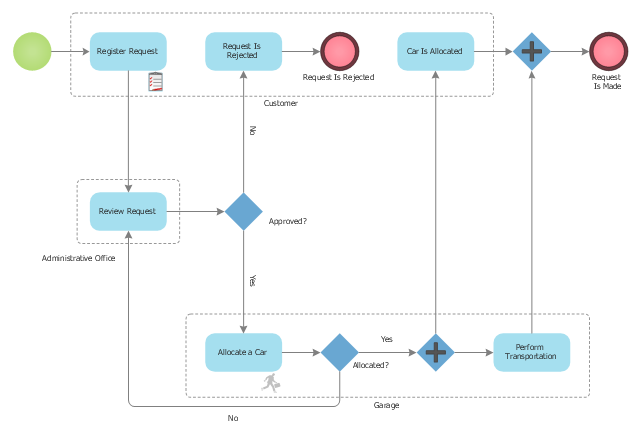
This BPMN (Business Process Model and Notation) diagram sample represents the taxi service order procedure workflow.
"A business process or business method is a collection of related, structured activities or tasks that produce a specific service or product (serve a particular goal) for a particular customer or customers. It often can be visualized with a flowchart as a sequence of activities with interleaving decision points or with a Process Matrix as a sequence of activities with relevance rules based on data in the process. ...
There are three types of business processes:
(1) Management processes, the processes that govern the operation of a system. Typical management processes include "corporate governance" and "strategic management".
(2) Operational processes, processes that constitute the core business and create the primary value stream. Typical operational processes are purchasing, manufacturing, advertising and marketing, and sales.
(3) Supporting processes, which support the core processes. Examples include accounting, recruitment, call center, technical support. ...
The ... improvement areas are equally applicable to policies, processes and detailed procedures (sub-processes/ tasks). There is a cascading effect of improvements made at a higher level on those made at a lower level.
For instance, if a recommendation to replace a given policy with a better one is made with proper justification and accepted in principle by business process owners, then corresponding changes in the consequent processes and procedures will follow naturally in order to enable implementation of the policies" [Business process. Wikipedia]
The business process modeling diagram example "Taxi service order procedure - BPMN 1.2 diagram" was created using the ConceptDraw PRO diagramming and vector drawing software extended with the Business Process Diagram solution from the Business Processes area of ConceptDraw Solution Park.
Business process modeling
- Technical Flow Chart Example | Teachers Service Commission ...
- Azure Architecture | Basic Service Operation In Workflow Auto Shop
- Hotel Operation Flow Chart
- Operation Flow Of Cafe
- Providing telecom services - Cross-functional flowchart | Cross ...
- Customer Service Flow Chart Template
- Sales Flowcharts | Hotel Operations Process Chart
- Hotel Operations Chart
- Process Flowchart | Copying Service Process Flowchart. Flowchart ...