How to Collaborate in Business via Skype


Best Value Stream Mapping mac Software

Lean Manufacturing

Value stream with ConceptDraw DIAGRAM

Half Pipe Plans

Settlement Process Flowchart. Flowchart Examples

Organizational Charts with ConceptDraw DIAGRAM

Kanban Board Software: A Comprehensive Overview

Double-headed Cross Functional Flowchart

Critical Path Method in ConceptDraw PROJECT

This circular arrows diagram sample depicts the Plan–Do–Check–Act cycle.
"PDCA (plan–do–check–act or plan–do–check–adjust) is an iterative four-step management method used in business for the control and continuous improvement of processes and products. It is also known as the Deming circle/ cycle/ wheel, Shewhart cycle, control circle/ cycle, or plan–do–study–act (PDSA). Another version of this PDCA cycle is OPDCA. The added "O" stands for observation or as some versions say "Grasp the current condition." This emphasis on observation and current condition has currency with Lean manufacturing/ Toyota Production System literature." [PDCA. Wikipedia]
The diagram example "PDCA cycle" was created using the ConceptDraw PRO diagramming and vector drawing software extended with the Circular Arrows Diagrams solution from the area "What is a Diagram" of ConceptDraw Solution Park.
Circular arrows diagram

How To Collaborate via Skype

 Manufacturing and Maintenance
Manufacturing and maintenance solution extends ConceptDraw DIAGRAM software with illustration samples, templates and vector stencils libraries with clip art of packaging systems, industrial vehicles, tools, resources and energy.
Cause and Effect Fishbone Diagram

The vector stencils library "Workflow diagrams" contains 54 symbol icons of workflow diagrams.
The workflow diagrams represent information flow, automation of business processes, business process re-engineering, accounting, management, and human resources tasks in industry, business, and manufacturing.
Use this library to draw workflow diagrams in the ConceptDraw PRO diagramming and vector drawing software extended with the Workflow Diagrams solution from the Business Processes area of ConceptDraw Solution Park.
www.conceptdraw.com/ solution-park/ business-process-workflow-diagrams
Accounting

Accounts Payable

Accounts Receivable

Bank

Board of Directors

Copy Center

Customer Service

Distribution

Finance

Information Systems

International Division

International Marketing

International Sales

Inventory

Legal Department

Mailroom 2

Mailroom 1

Management

Manufacturing

Marketing

Motor Pool

Packaging

Payroll

Person 1

Person 2

Personnel/ Staff

Publications

Purchasing

Quality Assurance

Exchange

Reception

Research and Development

Sale contract

Shipping

Suppliers

Telecommunications

Treasurer

Warehouse

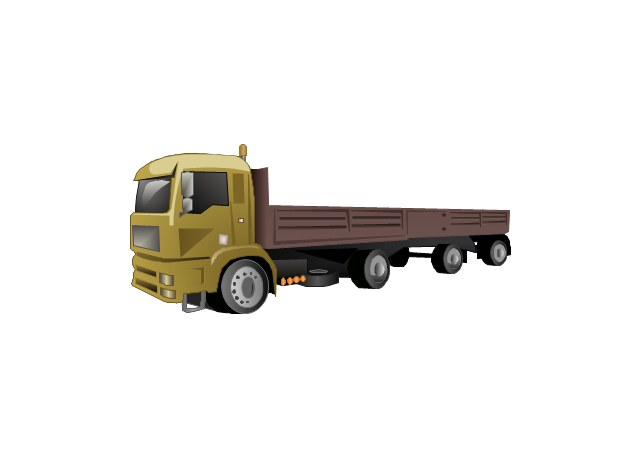
Lorry

Quality

Production

Box

Boxes

Open box

Payment

Receiving

Sales

Phone

Operator 1

Online booking

Operator 2

Server

Car

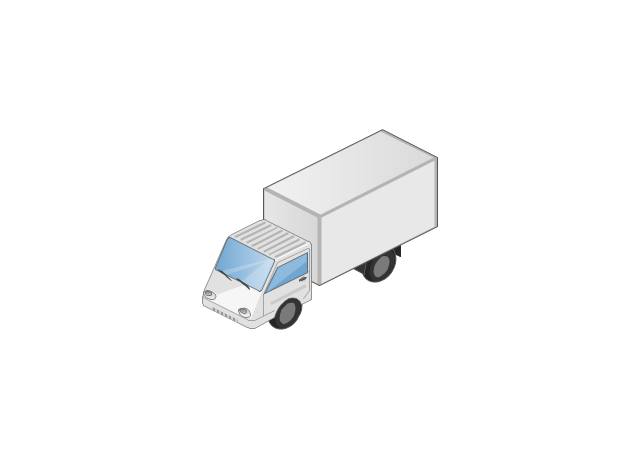
Mini truck

Onion Diagram as Stakeholder Mapping Tool

Bubble Map Maker

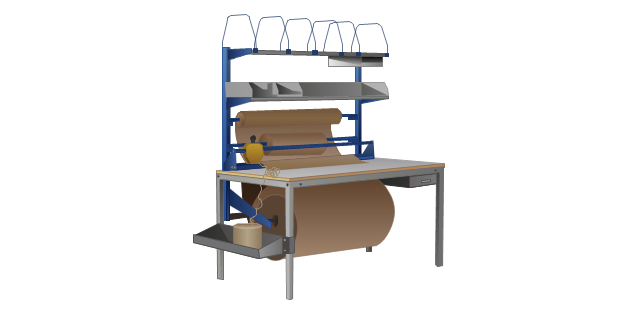
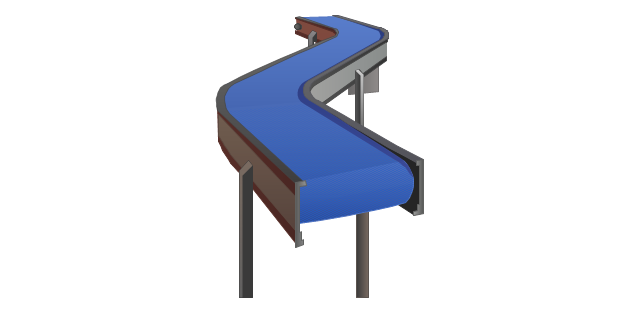
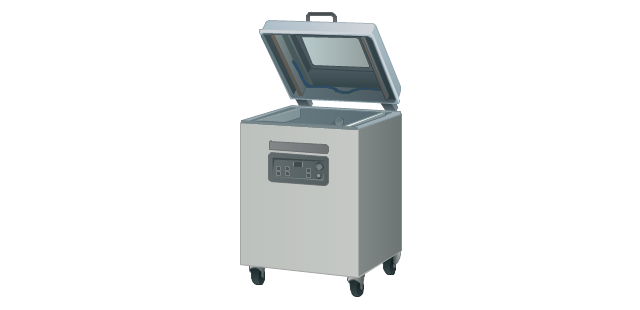
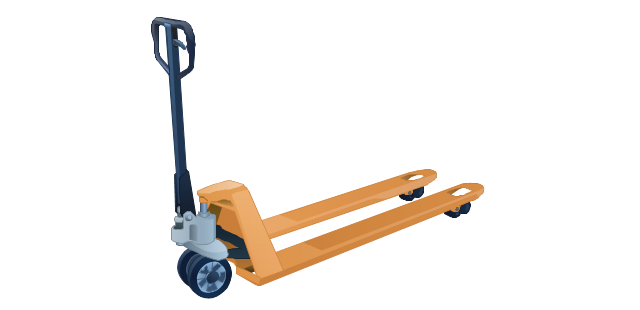
The vector stencils library "Packaging, loading, customs" contains 28 clipart images of packing materials and packaging equipment for drawing illustrations.
"Packaging is the technology of enclosing or protecting products for distribution, storage, sale, and use. Packaging also refers to the process of design, evaluation, and production of packages. Packaging can be described as a coordinated system of preparing goods for transport, warehousing, logistics, sale, and end use. Packaging contains, protects, preserves, transports, informs, and sells. In many countries it is fully integrated into government, business, institutional, industrial, and personal use." [Packaging and labeling. Wikipedia]
The clip art example "Packaging, loading, customs - Vector stencils library" was created in ConceptDraw PRO diagramming and vector drawing software using the Manufacturing and Maintenance solution from the Illustration area of ConceptDraw Solution Park.
Cardboard box
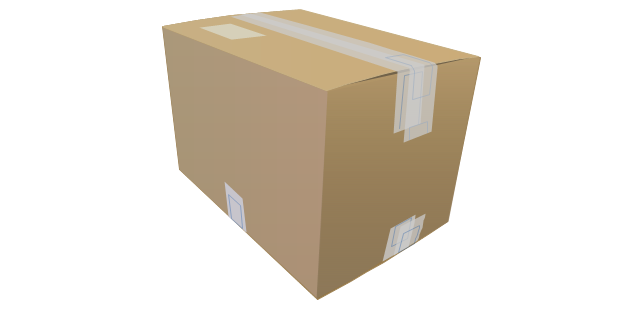
Cardboard box (open)
-packaging,-loading,-customs---vector-stencils-library.png--diagram-flowchart-example.png)
Paper bag

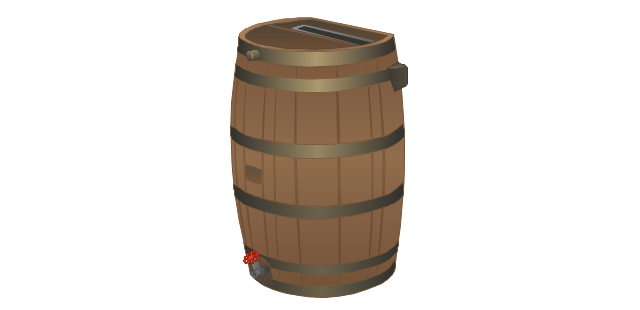
Woodgrain barrel
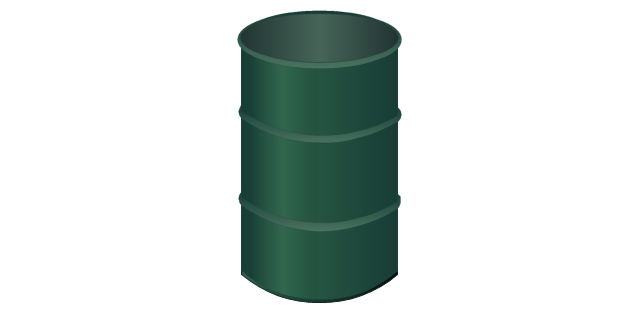
Barrel
Crate

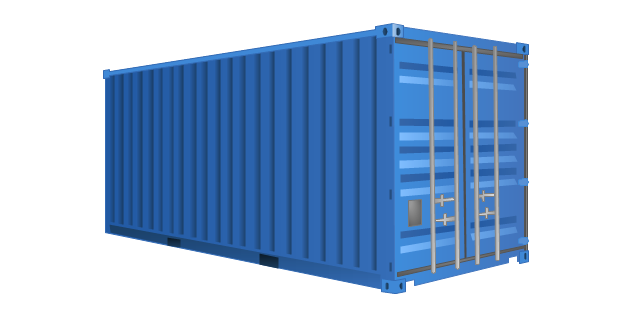
Container
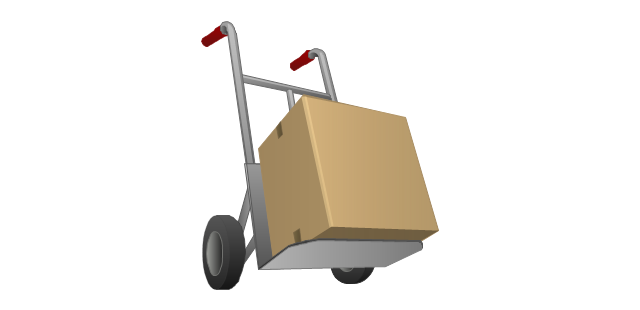
Handcart with cardboard box
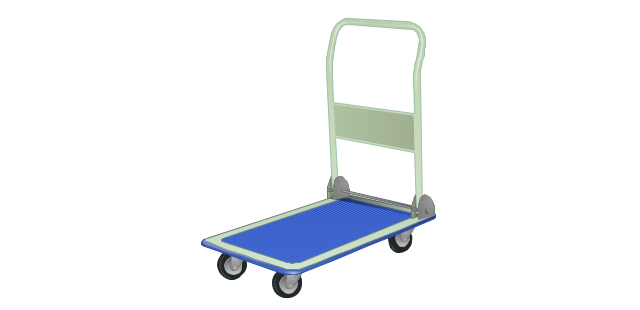
Flatbed trolley
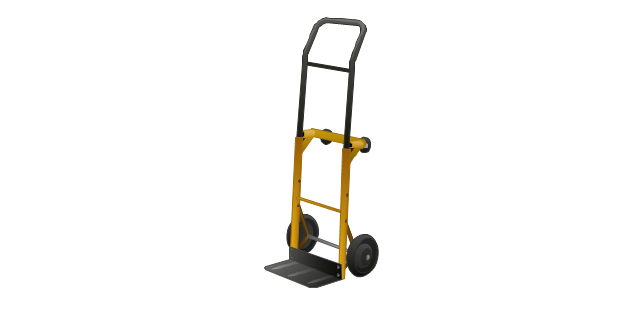
Hand truck
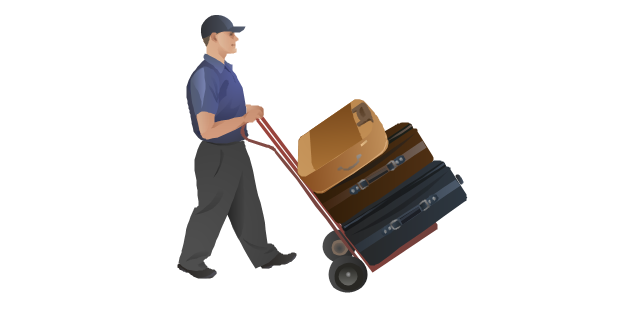
Porter
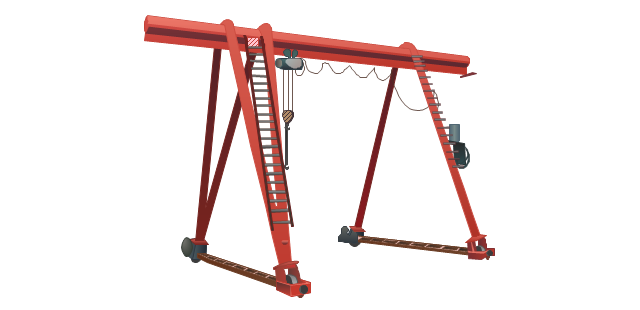
Gantry crane
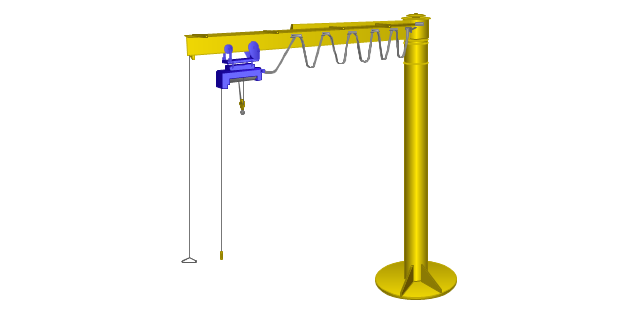
Jib crane
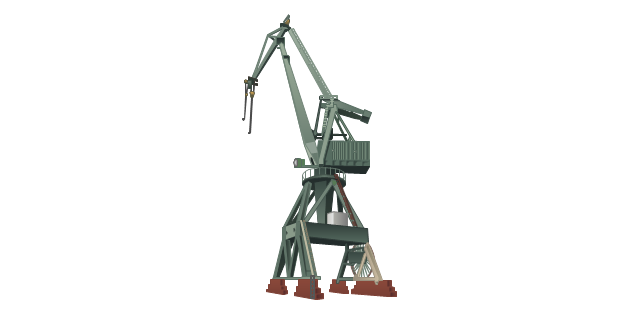
Level luffing crane
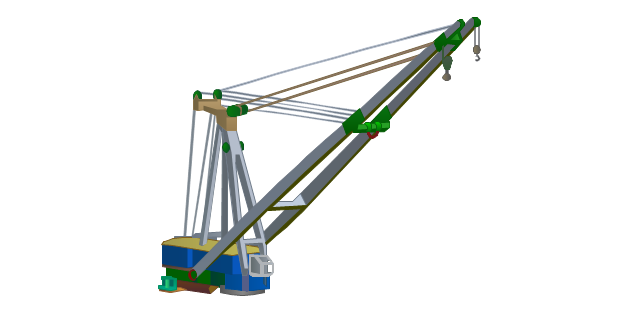
Deck crane
Packaging

Packaging machine
Packing conveyor
Vacuum packaging machine
State border sign

Border checkpoint
Customs sign
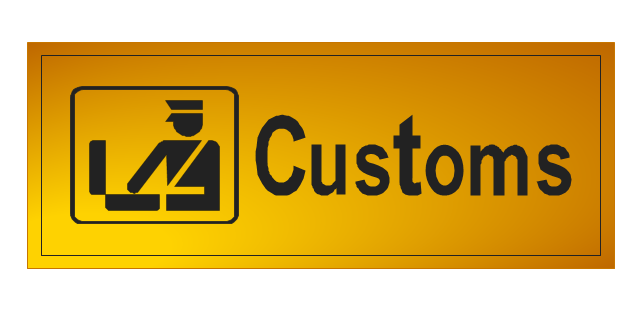
Border control
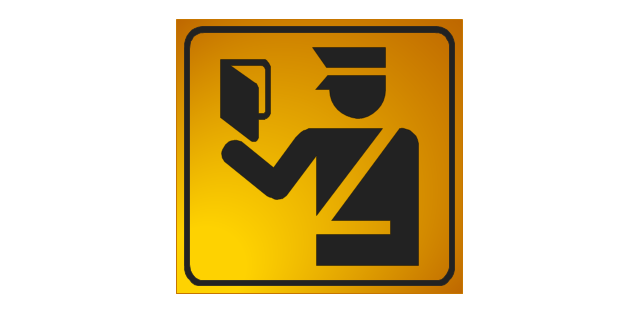
Port of entry office

Customs officer

Stocker with cardboard boxes

Warehouse workers

Pallet jack
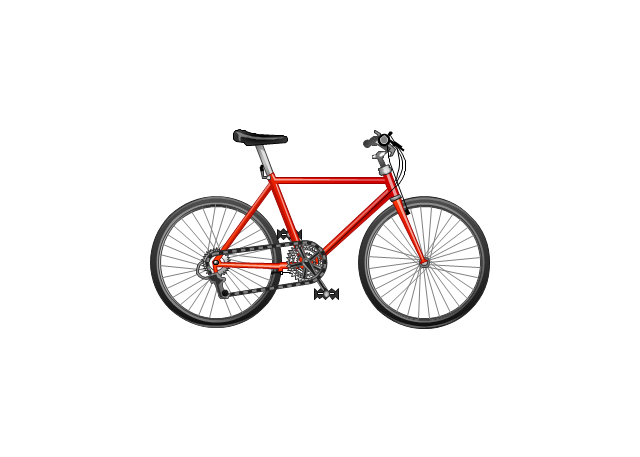
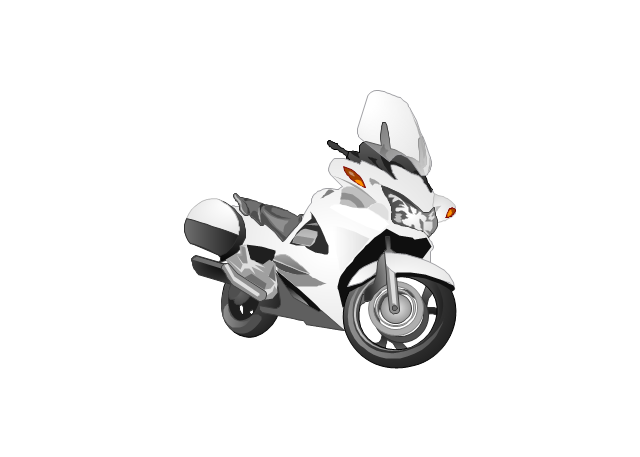
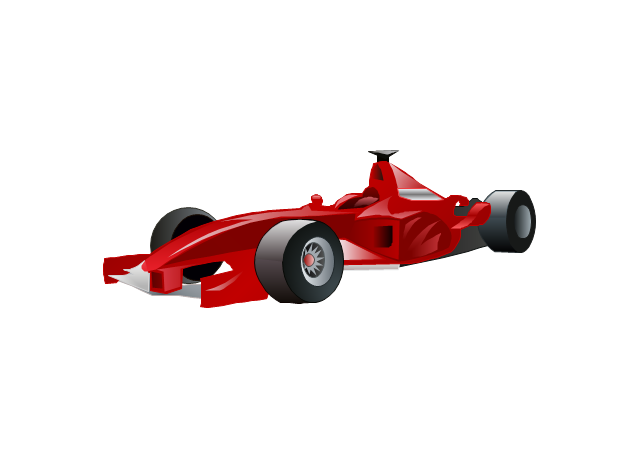
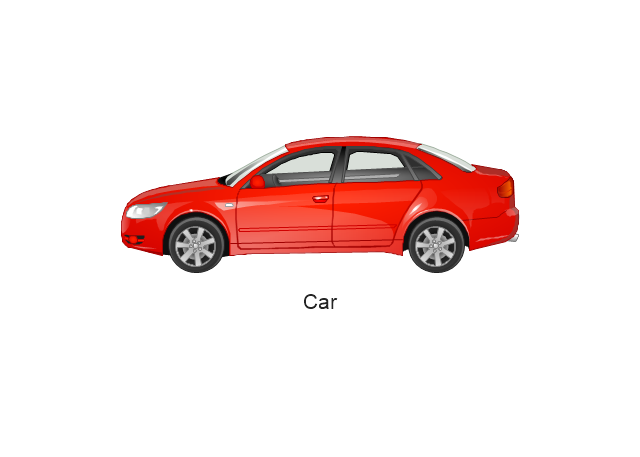
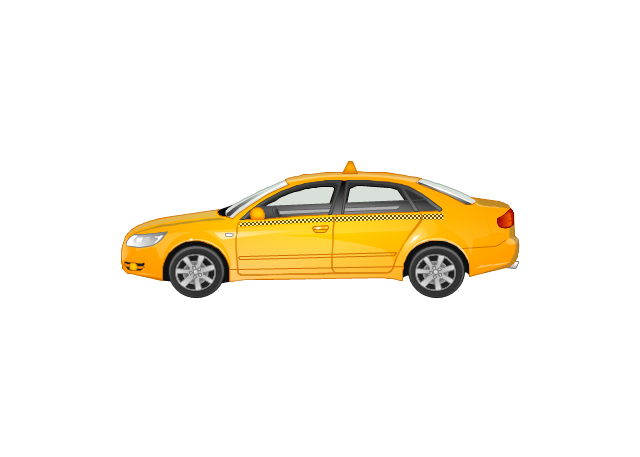
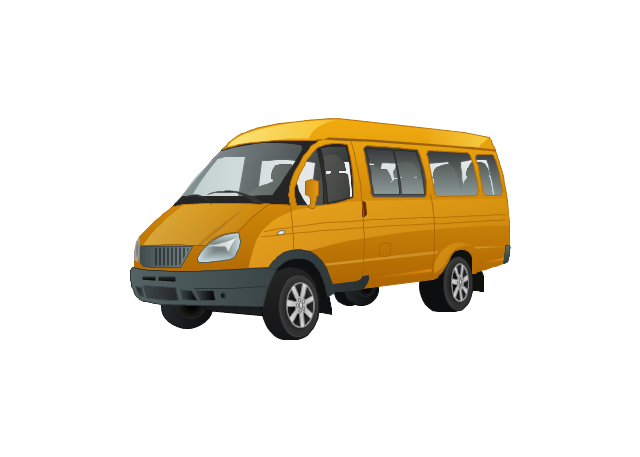
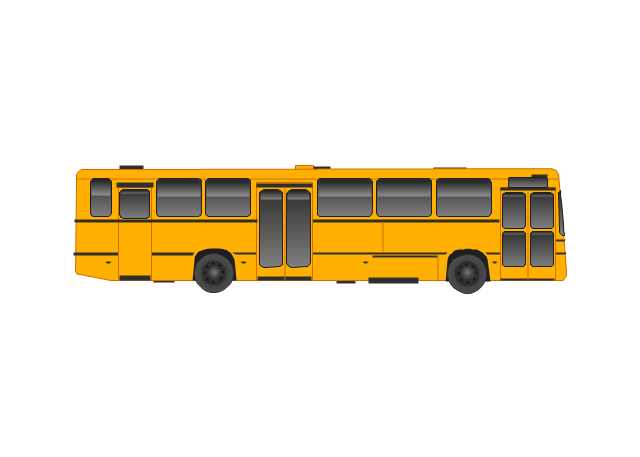
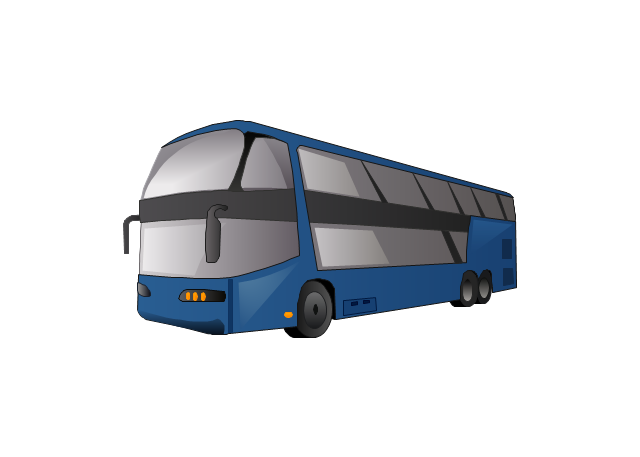
The vector stencils library "Road transport" contains 43 clip art images for creating vehicles and transportation illustrations, presentation slides, infographics and webpages using the ConceptDraw PRO diagramming and vector drawing software.
"Road transport (British English) or road transportation (American English) is the transport of passengers or goods on roads. ...
Transportation.
Transport on roads can be roughly grouped into the transportation of goods and transportation of people. In many countries licencing requirements and safety regulations ensure a separation of the two industries.
The nature of road transportation of goods depends, apart from the degree of development of the local infrastructure, on the distance the goods are transported by road, the weight and volume of the individual shipment, and the type of goods transported. For short distances and light, small shipments a van or pickup truck may be used. For large shipments even if less than a full truckload a truck is more appropriate. In some countries cargo is transported by road in horse-drawn carriages, donkey carts or other non-motorized mode. Delivery services are sometimes considered a separate category from cargo transport. In many places fast food is transported on roads by various types of vehicles. For inner city delivery of small packages and documents bike couriers are quite common.
People are transported on roads either in individual cars or automobiles, or in mass transit by bus or coach. Special modes of individual transport by road like rickshaws or velotaxis may also be locally available." [Road transport. Wikipedia]
The vector stencils library "Road transport" is included in the Aerospace and Transport solution from the Illustrations area of ConceptDraw Solution Park.
www.conceptdraw.com/ solution-park/ illustrations-aerospace-transport
Bicycle
Motorcycle
Race car
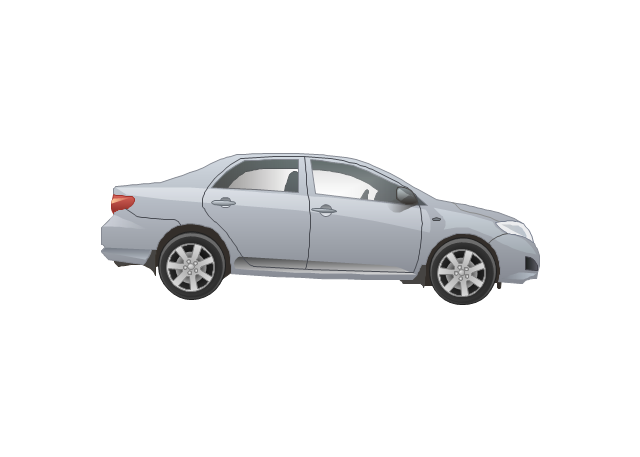
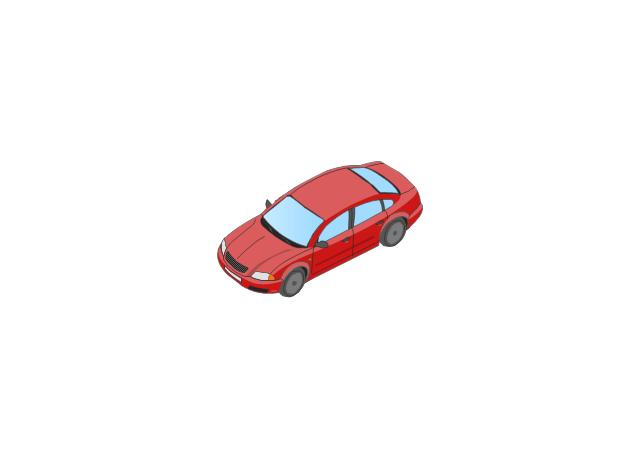
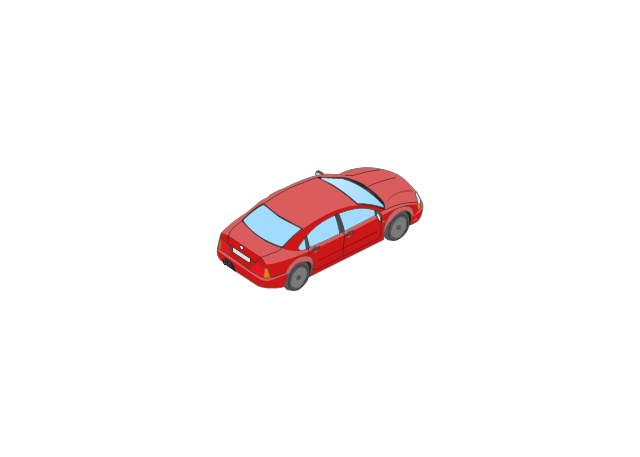
Car
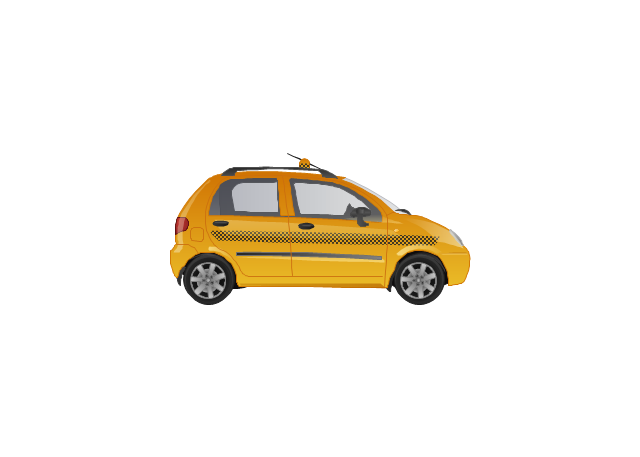
Taxi
Sedan
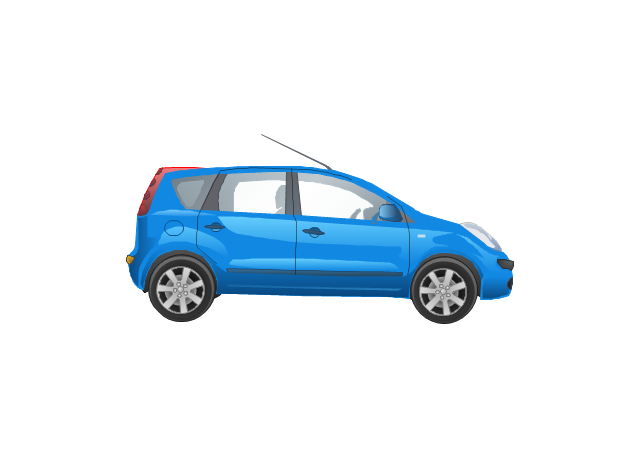
Hatchback
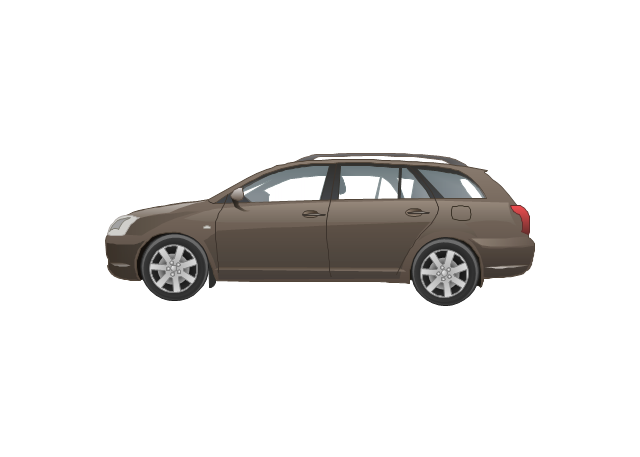
Estate car
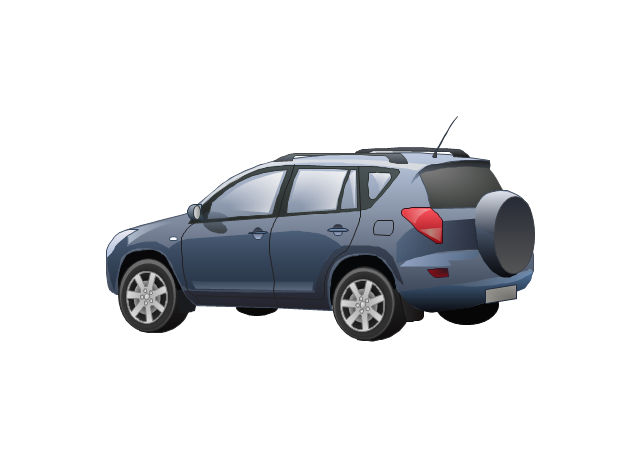
4x4
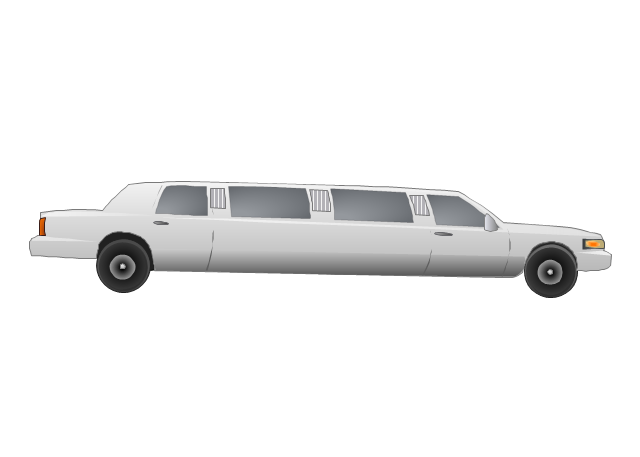
Limousine
Police car

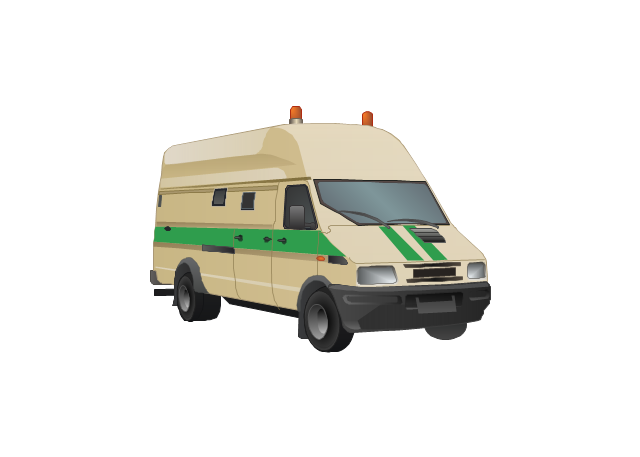
Ambulance

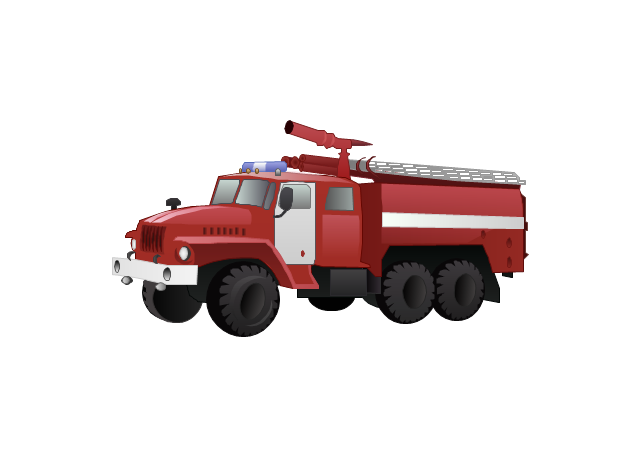
Fire apparatus
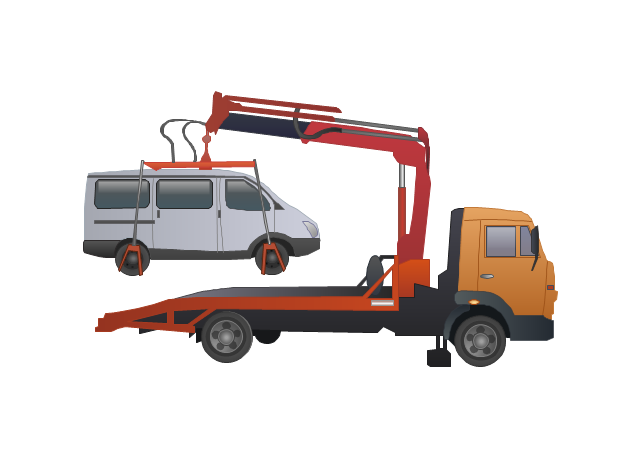
Wrecker
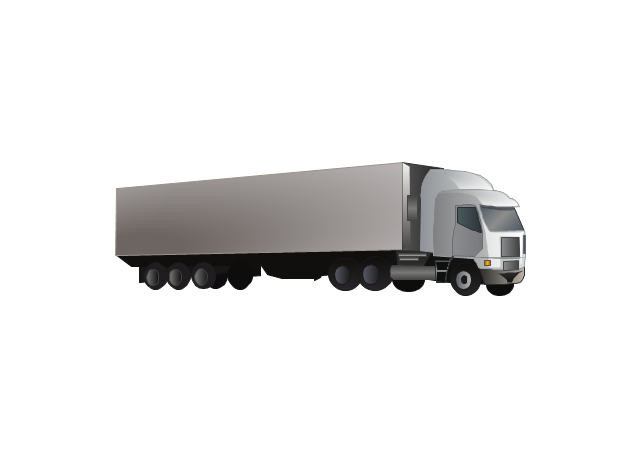
Semi truck

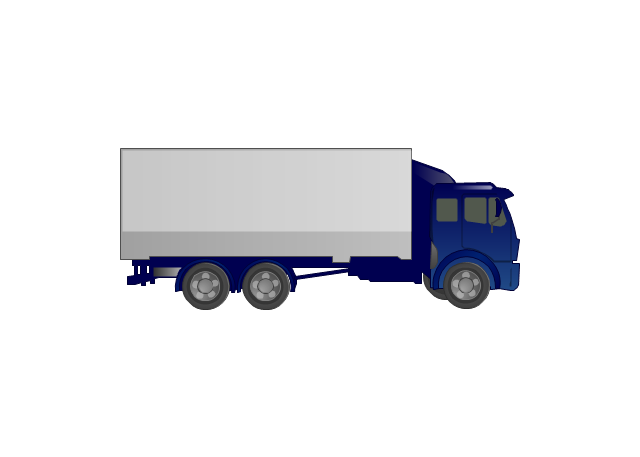
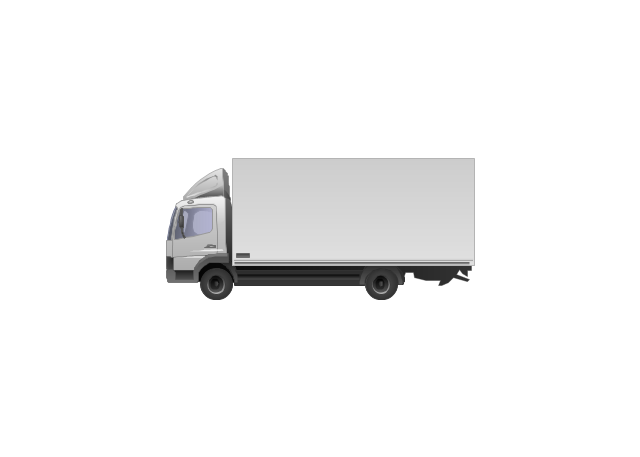
Truck
Trailer
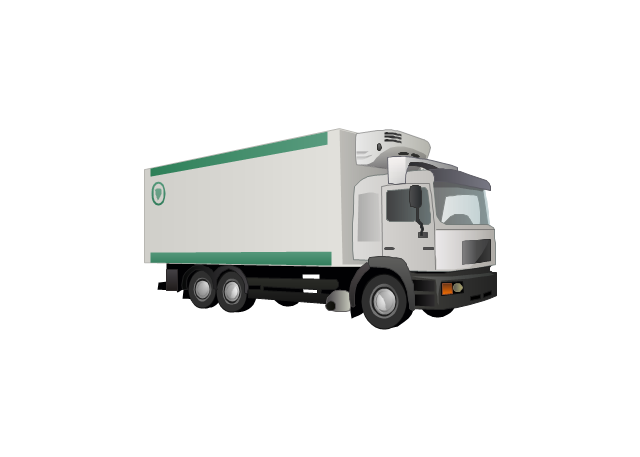
Refrigeration Truck
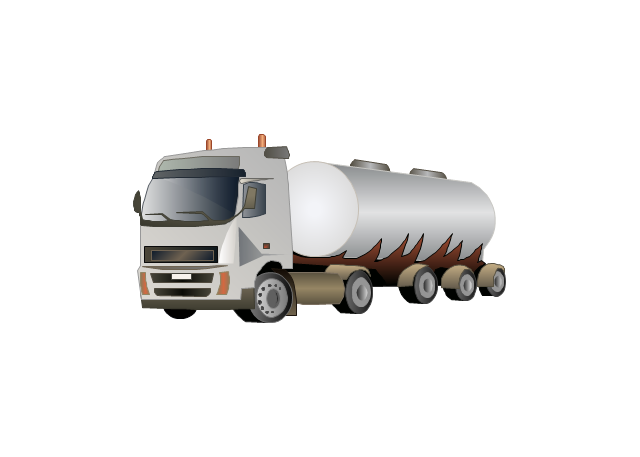
Petrol Tanker
Truck
Minibus
City Bus
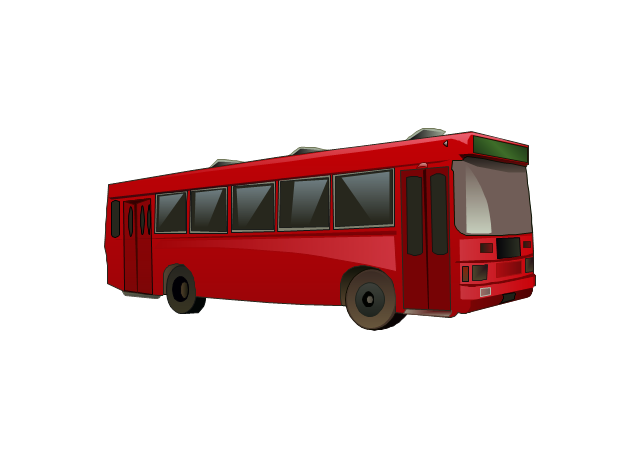
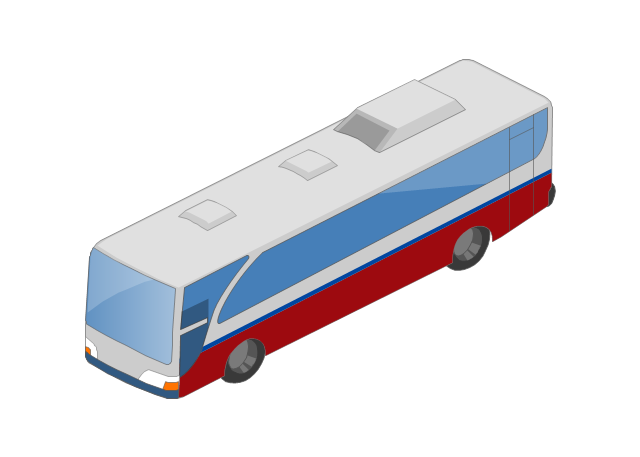
Bus
Sightseeing Bus

Double-decker Bus
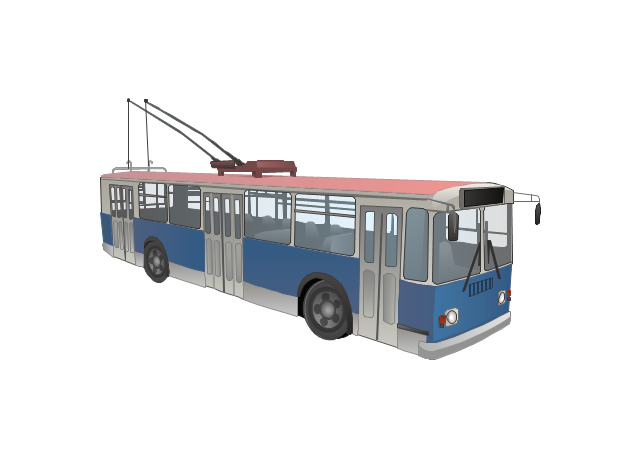
Trolleybus
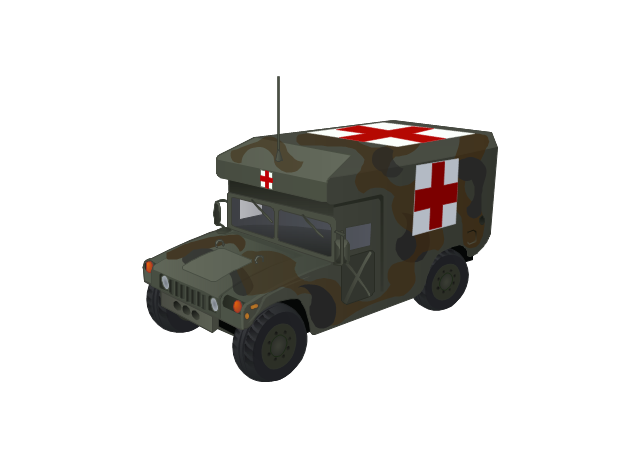
Military Ambulance
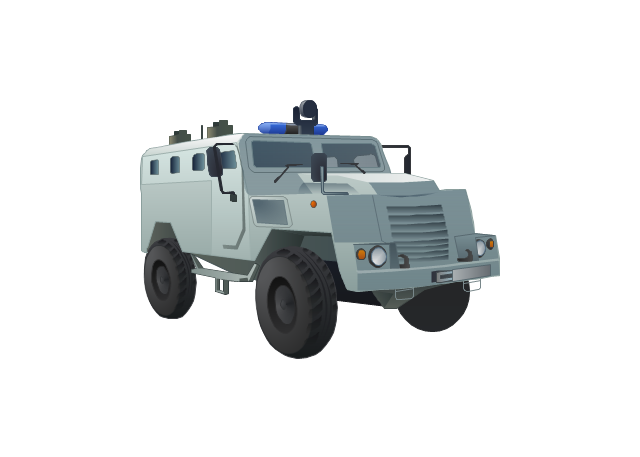
Armored police vehicle
First Aid Tent

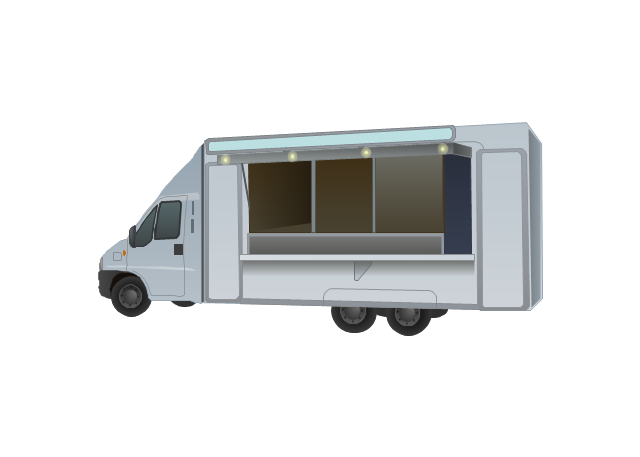
Catering Vehicle
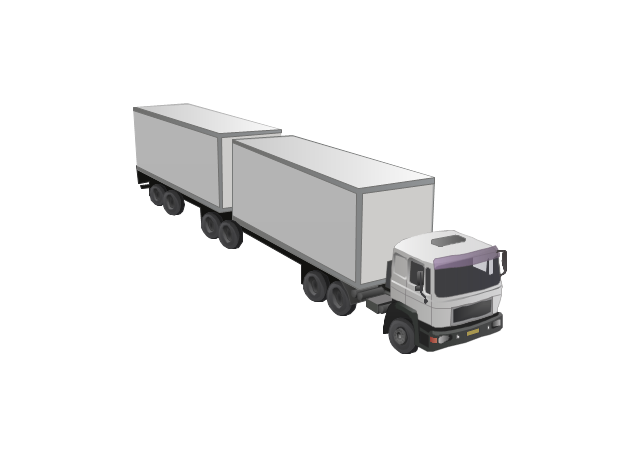
Semi-trailer
Fuel Tank
Fire Station
Signal Light
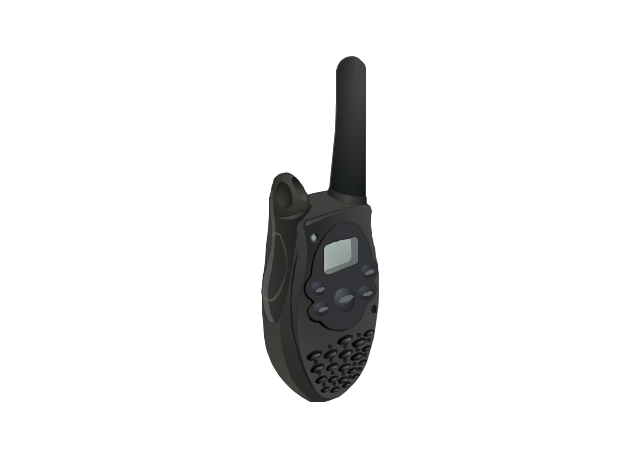
Walkie-Talkie
Lorry
B-Train
Taxi
Armored cash transport car
Car isometric
Car isometric
Box truck isometric
Bus isometric
The vector stencils library "Computer network" contains 51 symbols of computer network devices and equipment for drawing computer network diagrams.
"Network Mapping Software.
A number of software tools exist to design computer network diagrams / or generate visual maps of networks, servers, storage, services, data centers, and other peripherals. Broadly, there are two types of software tools - those that help create diagrams manually and those that generate them using automated / semi-automated approaches.
Type of Software.
(1) Manual - allows users to design and draw logical and physical topology diagrams by manually placing icons and connections.
(2) Automated - generate topology diagrams / maps by traversing the network and automatically discovering resident devices or by importing network data." [Comparison of network diagram software. Wikipedia]
ConceptDraw PRO is the software for manual design of computer network diagrams. The solutions of the Computer and Networks area in ConceptDraw Solution Park extend ConceptDraw PRO with vector stencils libraries, templates and examples for creating the computer network diagrams.
The symbols example "Computer network - Vector stencils library" was created using the ConceptDraw PRO diagramming and vector drawing software extended with the Computer and Networks solution from the Computer and Networks area of ConceptDraw Solution Park.
www.conceptdraw.com/ solution-park/ computer-and-networks
Laptop

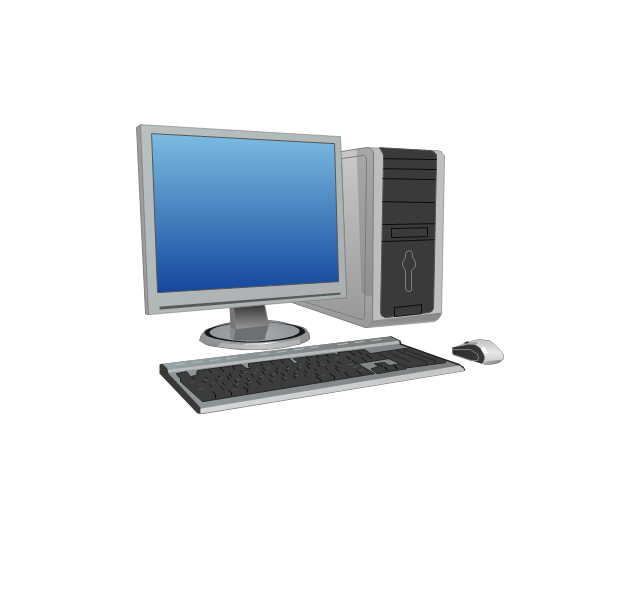
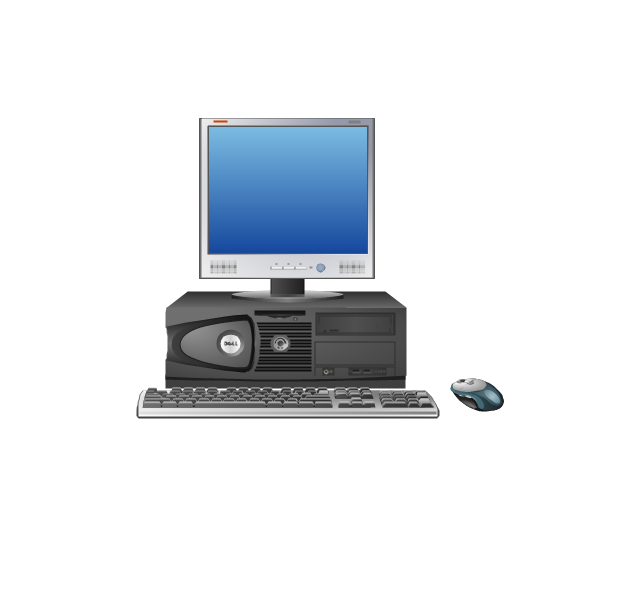
Desktop computer
Firewall
Bus

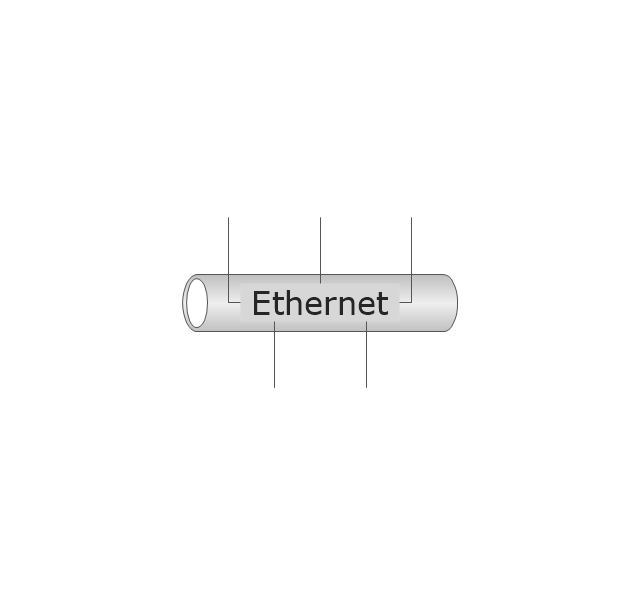
Ethernet
Star network

FDDI Ring

Token-ring

Comm-link

Modem
Laser printer
Inkjet printer
Image scanner
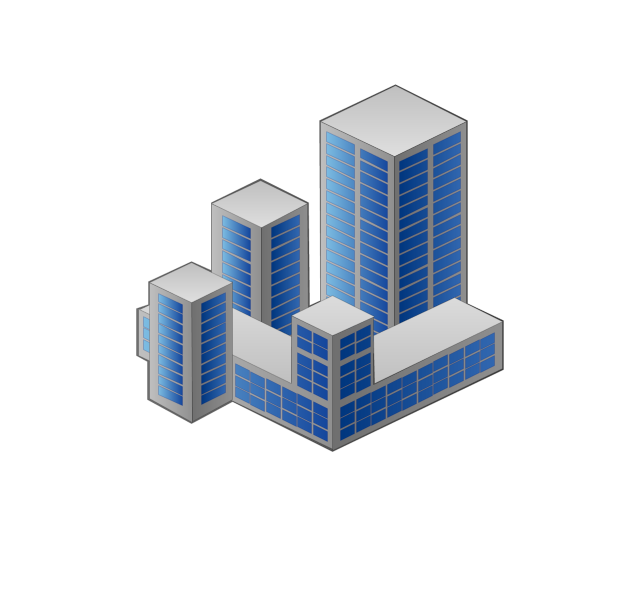
City
Ethernet hub
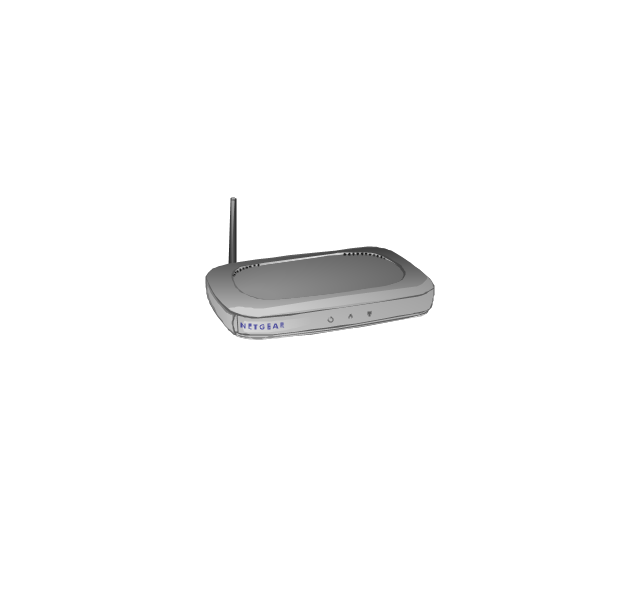
Wireless router
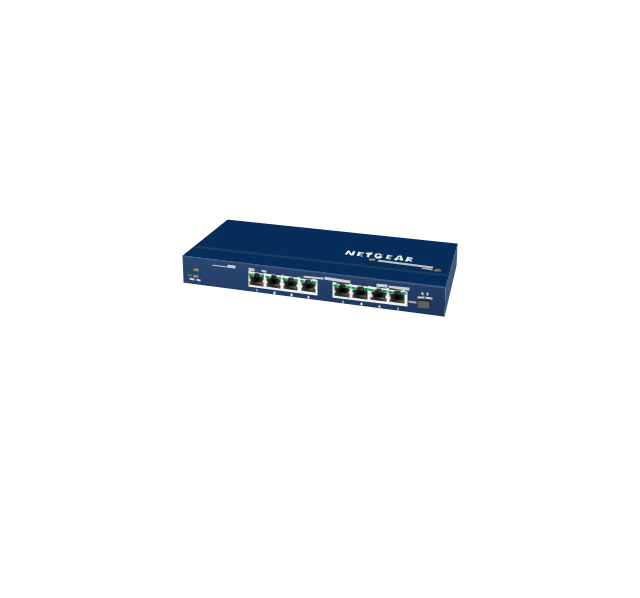
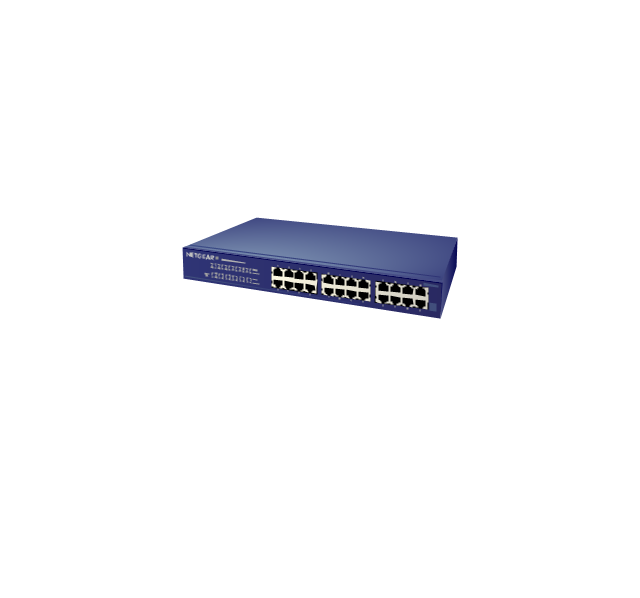
Network switch
iPod Classic

iPhone/ iPod Touch

Xserve RAID
XServe
Apple Thunderbolt Display

Data store
Mac Pro
iMac
RAID
Mainframe

Rack-mountable server
Server

PDA

Cloud

Computer monitor
Workstation
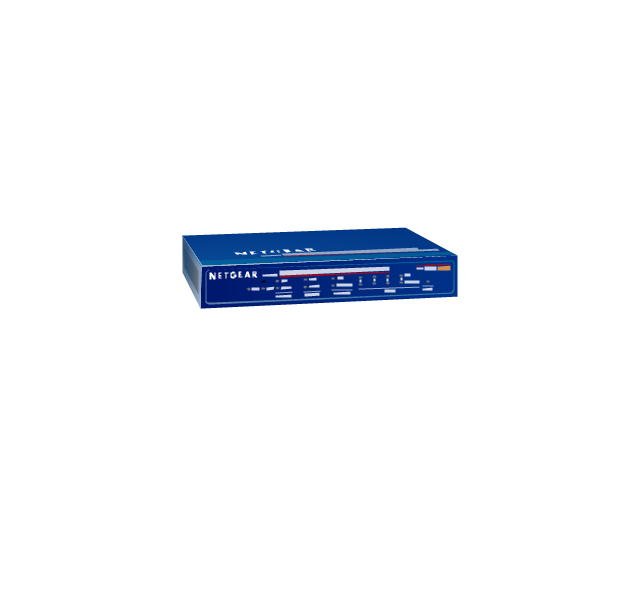
Router
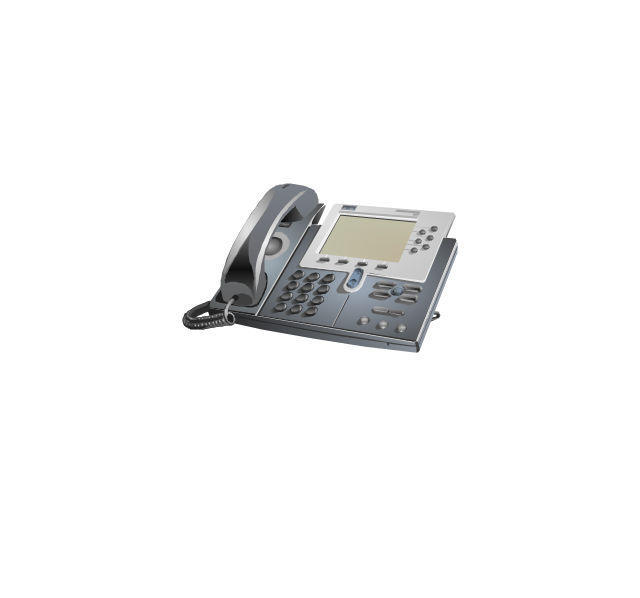
IP Phone
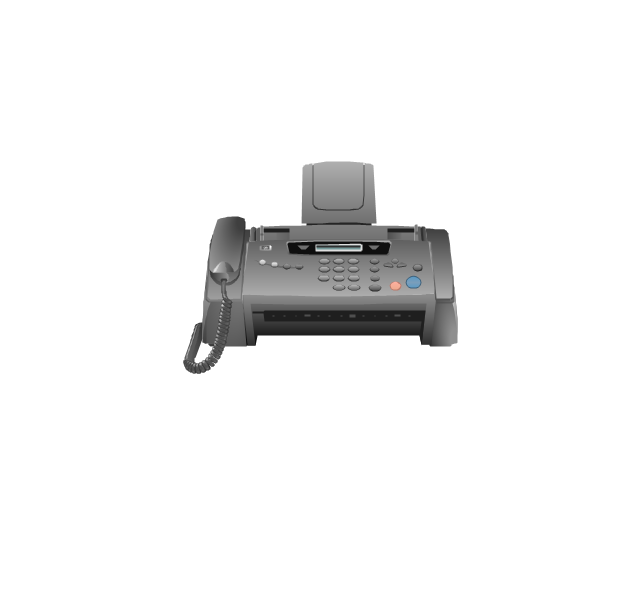
Fax
Mobile phone
Smartphone
Compact Disk

Mouse

Apple Wireless Mouse

Computer keyboard
Apple Keyboard
Radio tower

Satellite dish
Satellite
Webcam
AirPort Extreme

Airport Express
MacBook

iPhone 4

- Process Flowchart - Template | Flowchart Toyota Production System
- Process Flowchart | Toyota Manufacturing Process Flow Chart
- BPR Diagram. Business Process Reengineering Example | Event ...
- How to Build a Flowchart | Flowchart Symbols In Toyota
- Manufacturing 8 Ms fishbone diagram - Template | Enterprise ...
- Best Value Stream Mapping mac Software | Manufacturing and ...
- Value stream map - Template | Toyota Production System Timeline
- Conceptual diagram of the Kanban System | Gambar Conceptual ...
- Manufacturing 8 Ms fishbone diagram | Toyota Production Flow
- Best Value Stream Mapping mac Software | Supply Chain Map ...