Made with
ConceptDraw
DIAGRAM 18

Lean Manufacturing

Lean manufacturing or lean production is a concept of organization's management which is based on the constant effort to eliminate all kinds of losses. Lean manufacturing requires involvement of each employee in the process of business optimization and maximum customer orientation.

The main principles of the lean manufacturing concept are evaluation of the value of product for the final consumer at each stage of its creation, and also creation of a continuous process of eliminating waste - the elimination of any actions that consume resources but create no value for the end user. As a synonym for the concept of loss sometimes is used the term from the Toyota's production system — "muda" which meaning all sorts of costs, losses, waste, garbage.

According to the lean manufacturing concept, all company activities are divided on the operations and processes that add value for the consumer, and the operations and processes that don't add value for the consumer. The objective of lean manufacturing is the systematic reduction of the processes and operations which don't add value.

ConceptDraw DIAGRAM diagramming and vector drawing software enhanced with Value Stream Mapping solution from the Quality area of ConceptDraw Solution Park is perfect for the lean manufacturing.

Lean Manufacturing *

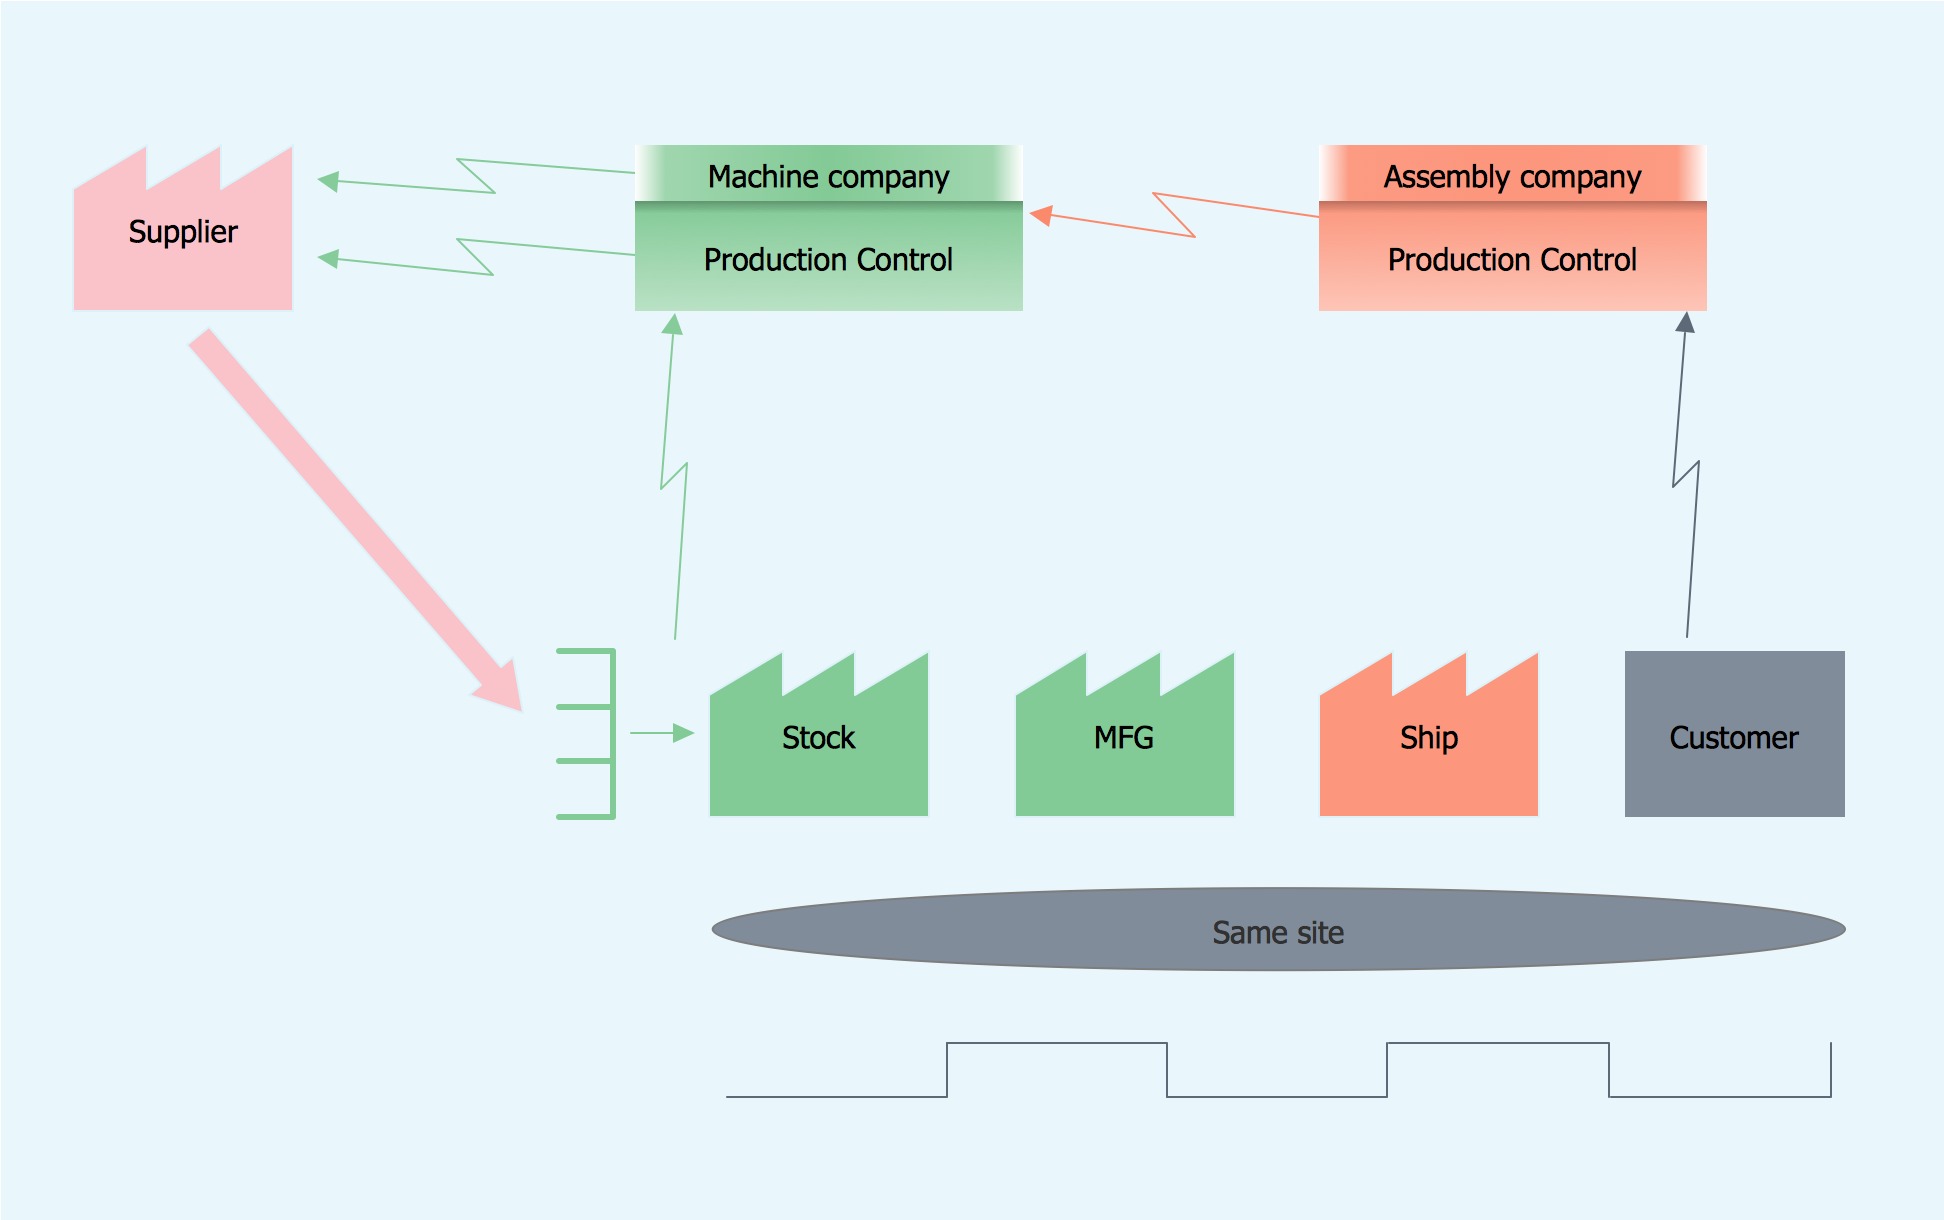
Example 1. Lean Manufacturing

Value Stream Mapping Solution offers the extensive drawing tools for the lean manufacturing process. The great value has the availability of predesigned vector objects in Value Stream Mapping library of the Value Stream Mapping Solution. These ready-to-use objects let you the possibility to draw without efforts - all that you need is simply drag ready objects from the library to the document, arrange and connect them and make style changes.

Value Stream Mapping Library Design Elements

Example 2. Value Stream Mapping Library Design Elements

The lean manufacturing sample you see on this page was created in ConceptDraw DIAGRAM software using the Value Stream Mapping Solution for ConceptDraw Solution Park. An experienced user spent 10 minutes creating this sample in ConceptDraw DIAGRAM

Use the Value Stream Mapping Solution for ConceptDraw DIAGRAM to realize effectively the lean manufacturing process and easily draw professional looking diagrams.

All source documents are vector graphic documents. They are available for reviewing, modifying, or converting to a variety of formats (PDF file, MS PowerPoint, MS Visio, and many other graphic formats) from the ConceptDraw STORE. The Value Stream Mapping Solution is available for all ConceptDraw DIAGRAM


THREE RELATED HOW TO's:
There are many tools to manage a process or to illustrate an algorithm or a workflow. Flowcharting is one of those tools. However, it may be difficult to show complex processes that require multiple attributes or several people in a simple flowchart, so a cross-functional flowchart would be a solution for that situation. To create such flowchart, group processes and steps to labeled rows or columns, and divide those groups with horizontal or vertical parallel lines. It is worth mentioning that there are different types of cross-functional flowcharts, like opportunity or deployment flowchart. This diagram shows a cross-functional flowchart that was made for a trading process. It contains 14 processes, distributed through 5 lines depicting the participants who interact with the process. Also there are connectors that show the data flow of information between processes. The cross-functional flowchart displays a detailed model of the trading process, as well as all participants in the process and how they interact with each other. The lines in the flowchart indicates the position, department and role of the trading process participants.Cross-Functional Flowchart
Picture: Cross-Functional Flowchart
Related Solution:
A flowchart is a simple but very functional tool when it comes to understanding a workflow or to removing unnecessary stages from a process. When drawing flowcharts, keep in mind that there are four common types of flowcharts, like document flowcharts and data flowcharts that show control over a data or document flow over a system. To show controls on a physical level, use system flowcharts. In addition, to show controls in a program, you can draw a program flowchart. This flowchart diagram represents the piece of an article editing process, that involves the author and editor. It was created using the Basic Flowchart notation that consists from the basic flowchart symbols. The start and the end of the process are indicated with "Terminator" symbols. The "Process" symbols show the action steps consisting from making edits and searching for a compromise, when the author does not agree with the suggestions of the editor. The "Process" symbol is the general symbol in process flowcharts. The "Decision" symbol indicates a branching in the process flow. There are two branches indicated by a Decision shape in the current flowchart (Yes/No, Disagree/Agree). This basic flowchart can be used as a repeating unit in the workflow diagram describing the working process of some editorial office.Types of Flowcharts *
Picture: Types of Flowcharts
Related Solution:
The Value stream is a totality of all actions on the projection, order composition and production: starting from creation a product project to launching this product, from order to delivery, from extraction of raw materials to ready product manufacturing. Value stream mapping is a process of visualization of these actions and creation of a detailed and graphical map.Value stream with ConceptDraw DIAGRAM  *
Picture: Value stream with ConceptDraw DIAGRAM
Related Solution:
ConceptDraw
DIAGRAM 18