"Causes in the diagram are often categorized, such as to the 6 M's ...
The 6 Ms (used in manufacturing industry):
(1) Machine (technology);
(2) Method (process);
(3) Material (Includes Raw Material, Consumables and Information.);
(4) Man Power (physical work)/ Mind Power (brain work): Kaizens, Suggestions;
(5) Measurement (Inspection);
(6) Milieu/ Mother Nature (Environment).
The original 6Ms used by the Toyota Production System have been expanded by some to include the following and are referred to as the 8Ms. However, this is not globally recognized. It has been suggested to return to the roots of the tools and to keep the teaching simple while recognizing the original intent; most programs do not address the 8Ms.
(7) Management/ Money Power;
(8) Maintenance." [Ishikawa diagram. Wikipedia]
This 8Ms Ishikawa diagram (manufacturing cause and effect diagram) template is included in the Fishbone Diagram solution from the Management area of ConceptDraw Solution Park.
8Ms Ishikawa diagram

Value stream with ConceptDraw PRO

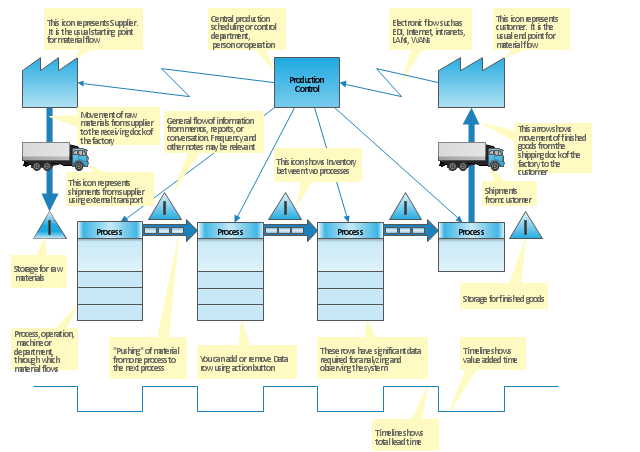
"Value stream mapping is a lean management principle used to analyze and design the flow of materials and information required to bring a product or service to a consumer. Pioneered by Henry Ford in the 1920s, perfected by Toyota. At Toyota, it is known as "material and information flow mapping". It can be applied to nearly any value chain. ...
Value stream mapping has supporting methods that are often used in Lean environments to analyze and design flows at the system level (across multiple processes).
Although value stream mapping is often associated with manufacturing, it is also used in logistics, supply chain, service related industries, healthcare, software development, product development, and administrative and office processes." [Value stream mapping. Wikipedia]
This value stream map template explains the meanings of the VSM design elements.
This Value stream map template for the ConceptDraw PRO diagramming and vector drawing software is included in the Value Stream Mapping solution from the Quality area of ConceptDraw Solution Park.
VSM template
 Event-driven Process Chain Diagrams
Event-driven Process Chain (EPC) Diagram is a type of flowchart widely used for modeling in business engineering and reengineering, business process improvement, and analysis. EPC method was developed within the Architecture of Integrated Information Systems (ARIS) framework.
VSM

- Data Flow Diagram Model | Process Flowchart | Manufacturing 8 Ms ...
- Data Flow Diagram Model | Manufacturing 8 Ms fishbone diagram ...
- Data Flow Diagram Model | DFD - Model of small traditional ...
- Toyota Production System Timeline
- Process Flowchart | Basic Flowchart Symbols and Meaning | Flow ...
- Diagram Of Production Cycle
- Data Flow Diagram Model | Process Flowchart | Manufacturing 8 Ms ...
- Manufacturing 8 Ms fishbone diagram - Template | Standard ...
- Production process
- Manufacturing 8 Ms fishbone diagram - Template | How Do ...
- Diagram Of The Production Process
- Flow chart Example. Warehouse Flowchart | Material Requisition ...
- Data Flow Diagram Model | Process Flowchart | DFD - Model of ...
- Process Flowchart | Total Quality Management Value | Data Flow ...
- Manufacturing 8 Ms fishbone diagram - Template | Fishbone ...
- Manufacturing 8 Ms fishbone diagram - Template | Process ...
- Data Flow Diagram Model | Process Flowchart | DFD - Model of ...
- 4 Ms fishbone diagram - Production process | Manufacturing 8 Ms ...
- 4 Ms fishbone diagram - Production process | Total Quality ...
- Process Flowchart | Total Quality Management Value | Flow chart ...